|
This page last changed on Jun 16, 2016 by mage.
click on the ADD COMMMENT button below to post your update
|
FIRST COMMENT!
I am writing my confluence now so I do not forget!
This week has been pretty successful. I have decided what function I want to use to map the data, a histogram function. The data that I am using the data collected from Dorado between 2003 and 2008. My mentor and I chose these years because this is the longest continuous data set and after 2008, the Dorado switched instruments and then the data is pretty patchy through 2015. So far, I have created maps showing the monthly averages for sea surface temperature, diatom counts, autotrophic dinoflagellate counts, and bioluminescence. I have also been able to figure out the depths of the thermoclines. I think I am going to be looking at comparing the depths of the thermoclines to the depths at where the maximum diatom, dinoflagellate, bioluminescence, and fluorescence are. This would be interesting to see if the thermoclines have any effect on this data.

Posted by asmith at Jun 29, 2016 10:23
|
|
So far every experiment I have run this week has been unsuccessful, which is unsurprising because failure accompanies scientific research in any discipline. As mentioned, my week on the cruise yielded beautiful preliminary experiment data, which showed me that my doliolid species has a photoprotein that can be activated (will emit bioluminescence) with the addition of calcium. Well this week I attempted the exact same experiments that I performed on the cruise with samples from the exact same doliolid colony (frozen) and I have received exactly zero signal. Other than going crazy over these failed experiments, I've been doing a ton of reading and Python script-writing - the former to figure out what is going wrong in my experiments, and the latter to organize my data once I do figure out the issue.
Despite the issues, I am confident that I will be able to activate the doliolid photoprotein one way or another. As both a blessing and a curse, there is nearly nothing published on the biochemical basis of doliolid bioluminescence, which makes my project extremely exciting but also leaves me totally uncertain on what to expect and test. So, I will have to play around blindly until I get some light - let's just hope that happens sooner than later!
Posted by cpayne at Jun 29, 2016 16:27
|
|
Cheyenne- I get the pun 
I managed to finish a first draft of my story map this week. This story map will be talking about ocean acidification, how it affects shellfish farmers and what CeNCOOS is doing to help these farmers with ever changing ocean conditions. Making this draft has been frustrating because I have been using ESRI's ArcGIS online story map tools, specifically the cascade design tool, which is said to be in beta testing mode. Honestly, it is extremely limited in your ability to customize what you want on the story map. For instance, you can change the text size to 3 predetermined sizes but each size is accompanied by a different font type. You cannot move the text boxes to where you want them and imported images are a fixed size, so finding images that are roughly the same dimension on the internet is very difficult.
I am also going to run into a problem with the software and giving CeNCOOS my end product. The desktop I have been using is ancient and therefore, has a hard time running most programs. Therefore, I have been running most of the mapping and other programs on my personal laptop which stores my maps on UCSB's GIS server. What I have to figure out is how to transfer those components over without having to make the map over again. At some point next week, I will be coming to you all and getting your feedback on my map! The goal is to have the final draft complete by the middle of July so that I can release the story map and get some feedback.
Posted by desmond at Jun 30, 2016 08:23
|
|
This week I've mostly been working on my proposal for the REU program. I finished it and sent it in to my mentor for review but it looks like I am going to need a lot of revising...On the bright side, I will know for sure what I will need to do come experiment day. It's been a bummer that the start of our experiment keeps getting pushed back since my mentor will be gone next week, but that does mean I have more time to mentally prepare myself. In the meantime, I will be gathering the materials needed to ensure the experiment goes as smoothly as possible and playing with other equipment I will be needing such as the dissecting microscope.
Posted by asan at Jun 30, 2016 10:21
|
|
Spent Monday and Tuesday writing more detailed GUI scripts for spectra fitting, working with the old sea water spectra collected in lab. We also went through some of the plumbing plans for our July trip on the Flyer, using piston accumulators rather than gas cylinders to pump Argon into the D-sampler. This helps because we can reclaim the argon we used (hopefully with minimal jelly bits), and also adjust pressure mid-dive by pumping seawater into the back of the piston. Since we plan to go to 3000m, the 3000 psi limit of gas cylinders won't be enough to push any gas out, so we need the different technique to flood the sampler.
On Wednesday I figured my GUI was about as good as it was going to get (and I was also getting tired of slogging through the MATLAB documentation on various figure, axes, uipanel, uicontrol, group, primitive line, and other object properties and callback functionalities; along with every other MATLAB function and error handling technique imaginable), so I figured I'd try using some of the data we collected last week on the Carson. The seawater spectra we collected at every depth appear as expected: slight shifts in wavelength and relative intensities of the sulfate peak, water bending peaks, and water stretching peaks. The jelly spectra, however, had something weird going on. The sulfate peak and water bending peaks are essentially nonexistent and the water stretching peaks go completely wonky. We can no longer resolve just how many peaks are appropriate to fit in the stretching mode; it may be that one peak just dominates the other four, or they may add together in a more symmetrical pattern than before, or some may disappear in the noise while others add symmetrically, we really just don't know.
We also have absolutely no explanation for the disappearance of the bending modes. If the simplest interpretation of the data proves true, we have shown that jellyfish are basically just fresh water jelled in such a way that the molecules cannot bend. Both Peter and Ed doubt this is the right way to look at the data, particularly since spectra taken of jellies in the lab show both the sulfate peak and the water bending peaks, but as of now we have no better explanation. It may just be that the water stretching modes wash everything else out and the Raman spectroscopy technique is not sufficient to address the question. This also doesn't bode well for the trip in July, since we were hoping to use a ratio of the areas of the water bending peaks to the sulfate peak to determine the salt exclusions of the jellies. The non-existence of the peaks in our data appears to make that difficult...
Anyway, I'm now leaving that data interpretation to the actual chemists, and have gone back to looking at the seawater spectra we collected. We're planning to plot some different area ratios with respect to temperature and pressure, to see how the structure of water responds to those two variables. We have some good information from a paper that tested temperatures from 22 to 400 C and pressures from ambient to 256 bar, but they don't really show any trends and changed temperature in the wrong direction from what we need. We also don't have access to their raw data, so only know the few wavelengths they reported in the paper, and know nothing about the area under each curve except what I can extract by attempting to reproduce a few of their figures. Baseline correction is still a problem, but has mostly been solved and we should hopefully have some nice functional dependence soon.
Posted by mwoj at Jun 30, 2016 10:21
|
|
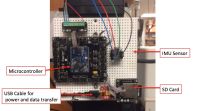
Finished writing the code in C# to read data from the IMU and save it to the SD card. Performed a speed test to determine the maximum rate that we would read/write to the SD card using both StreamWrite and FileStream methods. We are able to read/write data reliably at 45 Hz, however after 10,000 read/writes the garbage collector runs (a memory cleanup and allocation tool that operates in the background of your C# code) and interrupts our data logging for 240 milliseconds (that is too long). For now, this is acceptable, but for ocean testing we will need to fix this issue.
The rest of the week was spent preparing for an engineering review with my mentor Gene, and engineer Andy Hamilton. The meet is at 11am today ( I will update this after the meeting) but we are reviewing the dynamic model of the CPF that I have been working on in Matlab to get a second opinion and ensure there are no obvious errors in our approach or assumptions. I made a demonstration and a powerpoint for the meeting.
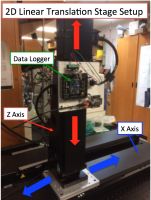
Now that the IMU and data logger are working, I was able to start running the linear translation table to collect acceleration data so that we can determine the minimum detectable acceleration using the inexpensive IMU.
Update from the meeting: presentation went well and Andy suggested a method for validating the output of the model using a closed form solution to the first order ordinary differential equation by solving explicitly for the CPF when velocity given a step input for the ocean current profile. We also discussed the concept of "added mass" that is important when calculating the dynamics of a body moving through a water. As a result, I will be updating my simulink model with a new added mass calculation.
Posted by nraymond at Jun 30, 2016 10:54
|
|
This week has been pretty exciting. One of my mentors (the one that has been with me these 3 weeks) was on vacation so I was working on my own all day and sending her the results of my cultures which was so good to see if I can do everything without any help.
And the best part is that it seems that I can!
Yesterday, I finally meet my mentor Alexandra Worden and today Thursday, my two mentors and I are trying to have a meeting and talk about how the project is going, what are we gonna do next and how exactly we're gonna do it.
During these weeks of work I have been doing pretty much the same, always trying to make the perfect media for my micromonas, measure them with the Accuri to see how many cells/mL we have, and transfer them into a new culture with fresh media for them continue growing, because as I said in my last confluence, we need a lot micromonas for our experiments. Even though it's sounds boring, it wasn't because everyday I have learn something new and also I get the chance to know what are doing the other people from lab and get to know them a little bit more. I'm starting to realize how much I like to work in a lab when you have a real project and you're doing what you're doing with a reason.
In two weeks, after talking to Alexandra and decide with her how are we gonna start the experiments, the fun begins and we'll try to see if they're mixotrophic or not!!
Posted by mariacl at Jun 30, 2016 11:11
|
|
Spent most of the week working on things that I will not be including in my research anymore soooo there is that... But despite slightly wasting time, I did improve my species identification skills! My original plan for my project was to focus on three urchin species; however, as of yesterday we decided that it would be best to just focus specifically on Echinocrepis rostrata because the other two species have yet to be identified in the footage for pulses 65-66. Linda briefly looked over the footage and noted that there were hundreds of individuals for Cystocrepis setigera. That being the case, it would take entirely too long for me to annotate all the necessary footage for all three species in time to complete my project and paper by the due date. Next year I will still be an MBARI collaborator so I hope to include the other two species in my future studies when I am writing my thesis in the fall for graduate school. I am currently going through pulses 65 and 66 of the ROV footage and measuring the length and width of each individual. I am using the length and width measurements to calculate biomass, which I will compare to density and color. I have been making histograms of size classes for pulses 64-66 so that I can assess any change in density and/or size of the local Echinocrepis rostrata community from 2006-2015. I am also looking into how color relates to density. I am assuming that the white colored individuals are juvenile and will be able to compare color with biomass measurements to see if this assumption is correct. I also assume that there is a positive correlation between density and white individuals, meaning when there is an increase in density you would also see an increase in white (juvenile) individuals. To correct for error in the measurements, I am taking 10% of the frame grab images and inputing them into Solidworks, which will allow for a more accurate measurement of area (biomass of individuals). I will use the best frame grab images as the 10% so that I can see how area measurements in VARS compare to measurements in Solidworks, and will then be able to reduce my error. I have also written up my outline for my paper, and will start working on the Introduction section as soon as I get some free time! Hope everyone is having a great week!
Posted by dfabian at Jun 30, 2016 11:30
|
|
Similar to Desmond, I too have been working with the Cascade style of ArcGIS's Story Map app this week, including shared frustrations over its design limitations. Granted, the Cascade app is in beta, but from a graphic/web designer's perspective, I'm peeved that some basic elements are absent from its current UI (user interface). Reverting to the design flexibilities of the more established style apps is certainly tempting!
In developing content for the Story Map website, I've been pouring through assets. Selecting (and, if need be, creating) relevant assets is critical, as the site will draw heavily from multimedia interaction. Written content to accompany these assets has also been a big to-do this week. The upcoming holidays and closures, along with scheduled cruises and vacations of staff members, has made for some challenging milestones to meet in my project's timeline – for those of you who have had to work in the absence of your mentors, I completely empathize with you!
On Tuesday, I got to tag along a day cruise aboard the Carson. Prior to going, I already knew I wouldn't get to experience the control room in action, as the trip did not involve ROV deployments. Like my previous experiences on boats, I wound up feeling tired and sleepy, eventually making my way to the cozy confines of one of the bunks. We got into some decent sized swells; twice I was woken by a feeling similar to having laid down on a trampoline that was being jumped on. Somewhere between stations M1 and M2, the decision was made to have the Carson turn back home. Z conveniently woke me up in time where I was able to make a sandwich, enjoy the approaching view of the smokestacks, and exchange yells with my buddy at MLML's dock as we passed by.
After yesterday's (Weds) seminar about Ed Ricketts, Matt and I joined George and Don Kohrs for lunch – what a treat! Don is an SJSU alum (like me!) and was a real pleasure to chat with. He sure knows his stuff, and I'll definitely be keeping my eyes peeled for more of his information and discoveries about Ricketts. For those of you who wanted more background info on Ricketts, the upcoming lab tour should help fill some gaps. I thought it was kind of funny how Don skirted around stating that Ricketts was a college dropout, and the myth of his little black book's existence is pretty hilarious.
This afternoon, I'll be joining Dallas and Desmond as part of a mock panel for the Watsonville Area Teens Conserving Habitats (WATCH) program, as they'll be participating in an exercise involving land use development. It's always interesting to get into the minds of youth and teens—should be interesting to hear what arguments and solutions they present!
Posted by jvalenzuela at Jun 30, 2016 11:52
|
|
Sorry I'm late, totally slipped my mind!
I've spent this week working with the scalaxb, a tool that lets me convert XML schema files (the structure that all the AUV mission scripts have to follow) into the language I've been writing code in. It's still experimental, so I had to figure out if it was functional enough for what I'd be using it to do. It seems to work! Which has opened up other cans of worms that I'm sifting through as much as I can. I'm also working on flipping the way the parser processes inputs from top-down to bottom-up because it's more intuitive and easier to change later. Third, I'm learning how to make a UI and how to have it give meaningful feedback, which is ultimately one of the main goals of making a new easy-to-use language. My mentor has been on vacation all week without as much as an internet connection, so certain steps have been going slower than I would have liked due to not having any outside input for troubleshooting, but hey! That's part of why I'm here, to get better at this kind of thing.
In the coming week (or weeks, depending on how much gets done during the very short week coming up) I'd like to finish up the syntax half of this project, meaning I have a full system in place for parsing, understanding, and providing feedback for how well an input adheres to a given grammar structure (like the schema files I mentioned earlier). Then, I can start worrying about the semantics half of this project: figuring out if the user input not only is grammatically correct, but also makes logical sense (i.e., is -2 a valid speed? Does the file newFile.xml exist?) and providing feedback based on that.
Posted by emeckler at Jun 30, 2016 13:51
|
|
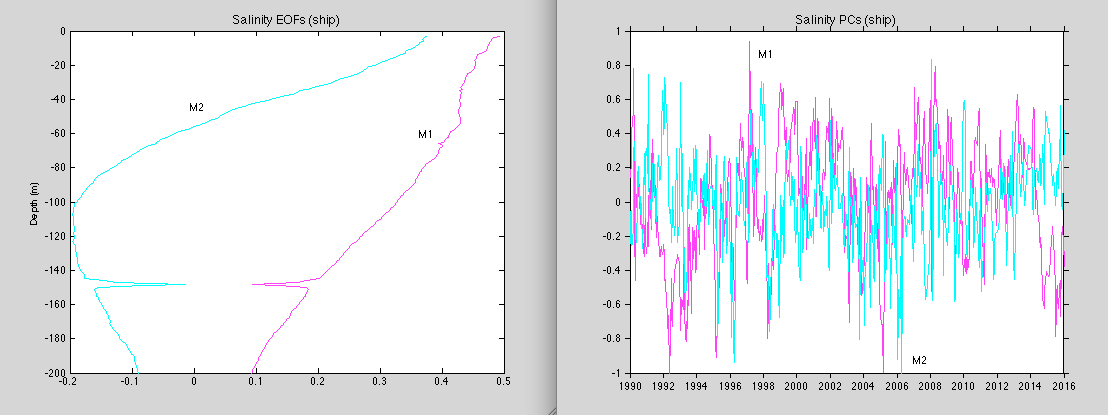
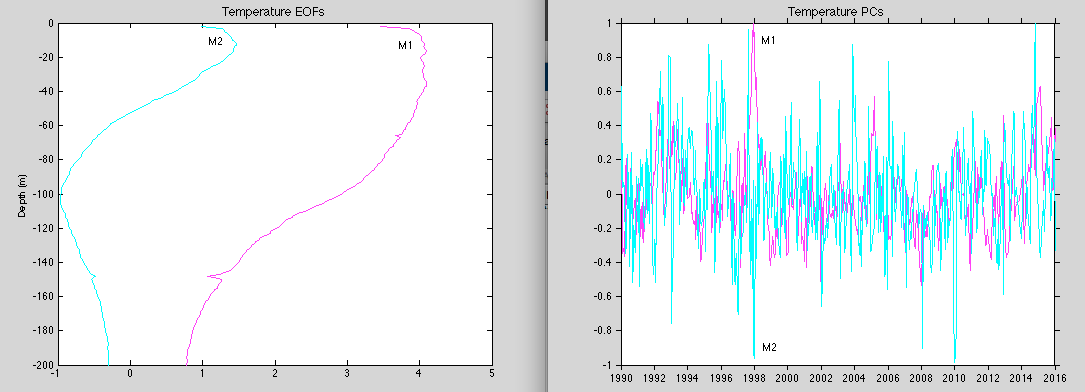
Have continued to perform primary component analysis (pca) on different physical and biological parameters I am focusing on at M1-temperature, salinity, nitrate, chlorophyll-and it has allowed me to pick out some interesting relationships between these variables that would not otherwise be so apparent. For example the first two "modes" of variability (the product of a map, or in my case, a vertical profile of anomalies and a time series) for both temperature and salinity are quite similar which was not necessarily to be expected. Mode 1 is clearly related to El Niño. Mode 2 is more difficult to interpret. Still lots of work to do to create a fuller picture of the variability at M1 since the time series started and understand how the recent events of 2014-2016 fit into it 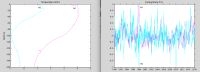 
Posted by gchavez at Jun 30, 2016 13:54
|
|
I told myself I would submit it on time and to be fair, this is closer than last week, but I'm still not quite on time. Sorry George and Linda. But this week has been really good! I actually accomplished some real stuff, other than just messing around with the software. Well, it was messing around with the software, but productive messing around because now I feel like I have a good grasp on the functionality and limitations.
I've never really tried to manipulate databases before, but this week I've learned the ins and outs of SQLite, so now I know how I am writing data to my database and how to manipulate it once it gets there. I still haven't spent a lot of time with wavelets, my other method for comparison, but I get the impression that that one is going to be less hands-on for me because it's still developing at a much higher level than I, with my meager biology degree, am going to be able to figure out. However, I do appear to have become a resident MBARI Pamguard expert, so that's pretty cool. I'm thinking about trying to go into the javascript of Pamguard, since it's open-source, and changing this one preset that I really hate where you can't set your own fixed axis for the waveform viewer, it's just stuck at 4s which is much too long for echolocation clicks. It's intimidating but also how cool would that be if I could alter something in the Pamguard software? We'll see. It's quite an undertaking since I've never even seen javascript code as far as I know. But I'm up to the challenge (maybe).
I've also been messing around with making my own classifier in Pamguard, because that's a constantly evolving thing--just because Pamguard as a piece of software has the capacity to detect a lot of clicks doesn't mean it's going to be good at classifying them as beaked whale or not beaked whale. So I've been trying to find a good medium between being too specific and missing the off-axis beaked whale clicks, and getting so broad to catch those that it starts catching dolphins too. It's a lot of fiddling, changing the frequency range, changing the zero crossings, things like that.
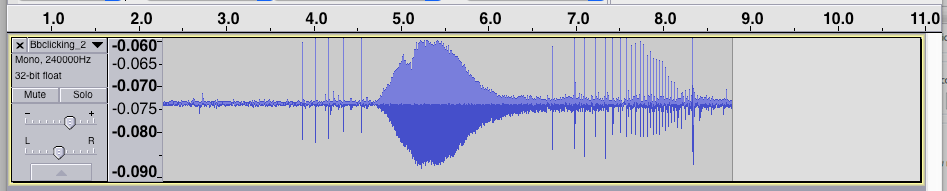
Yesterday the naval post-graduate school sent us a really great recording of a Baird's beaked whale, which is basically the older brother of Cuvier's beaked whales, from an acoustic tag so it's very clear and loud. It's so neat! The clip captures a feeding event, so you get the echolocation clicks, the buzz, and then the subsequent clicks too. So again, if you want to hear some super cool audio of a beaked whale feeding, let me know! Since everyone else seems to be including pictures, here is a picture of this really cool clip.
But anyway, work is a lot more fun when I am actually accomplishing things on my own, so it's been a good week. I am feeling less like I am out of my depth and more like I can figure things out on my own. It's got me thinking a lot about what sort of things I want to do in grad school (aka, am I prepared to take the plunge and become an engineer for the sake of understanding my whale friends? I don't know) and what I am most interested in. I guess that's kind of the point of this whole internship, figuring out what I want to do, so in that sense, I am being very successful.
Posted by ejacobs at Jun 30, 2016 13:57
|
|
This week we welcomed the third member, Daryll, on the NSF OA project. Each of us are taking a part in abalone development and seeing how climate change stressors affect them. I am looking at pre-fertilization, Aileen is looking at early development, and Daryll is looking at the juvenile stage. This allows us to build a more complete story on the effects of OA on abalone.
Tomorrow I will run a pilot experiment by dissecting one of the males for sperm and creating a suspension of sperm in filtered sea water. I will then sample from this suspension and take video of the sperm under the microscope over the course of 4 hours as well as analyze this video using ImageJ to get data. This experiment will generate a standard curve of sperm motility in response to gamete age. This will be useful in the future, when I conduct my experiment on sperm motility in response to high and low concentrations of pH and dissolved oxygen, as age may play a factor in the data.
Posted by tthisner at Jun 30, 2016 14:01
|
|
This week I tried to post a good, long confluence, but waited too long so now I have to start over. Along with Aileen I've been working on my REU proposal and presentation. I went out on the Carson on Tuesday and it was so fun! It was rough so we couldn't get to the M2 station but I filtered some eDNA and got hit with some water that soaked my pants. Yesterday was a little disheartening after we found there was no DNA concentration in 96 samples I had been working on for the past weeks. Basically during PCR cleanup we take the PCR products and add AMPure beads, beads with an adhesive-like surface to attach DNA. We wash the beads in hopes of ridding the DNA of primers from PCR, BSA and Mastermix previously added. Unfortunately there was something faulty with the beads that caused the DNA to NOT stick so when we washed it with ethanol and subsequently threw it out we (me and Kris Walz) actually threw out the DNA. When we ran gel electrophoresis on 96 samples that had taken lots of hand cramping to pipette, there were no bands. None. Nada. SO THAT WAS REALLY GREAT. But Kris is a saint and stayed late yesterday to rerun 3 PCR plates and she looked at them this morning and everything was good. So we are going to try to do PCR cleanup next Wednesday and hopefully everything goes as it should!
Posted by bcorbett at Jun 30, 2016 14:43
|
|
Very productive week with lots of "aha" moments. Using the event detection algorithms, we were able to automatically identify our animals of interest. this is a peniagone that was detected AUTOMATICALLY!!
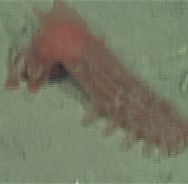
The next step is to make it do this on purpose... right now it can only tell me that there is something interesting in the screen, not that there is a peniagone in the screen.
We are also moving into the mid-water videos which provide a completely different set of problems. the biggest issue happens to be all the marine snow that the computer finds super interesting. >
Next week is going to be really exciting potentially, but it happens to fall on our short week. The good news is that the ball IS rolling and its rolling in the right direction.
So far we are also finding it takes A LOT of memory and time to do this. We are currently using 7 computers at the same time to run these 3 minute videos!
Posted by dhollis at Jun 30, 2016 15:22
|
|
Once again bringing up the rear. I've ade some progress with my matlab issue, by averaging down my time series. I'm still not convinced this is the way to go,but it atlas allows me to look at the rotary variability.
The next big step to take (hopefully this week) is to deal with the spatial variability. Because the platform from which my instruments are taking measurements (the rover) is moving around in space I have to demonstrate that the variability I'm seeing is not do to a changing position.
More to come on this later.
Posted by dburrier at Jul 06, 2016 07:35
|
|
 Screen Shot 2016-06-30 at 10.33.18 AM.png (image/png)