Analyzing Toolpath function
Use the Analyze Toolpath function to view toolpath properties, such as its coordinates, direction, operation number, and other information.
Green and red arrows indicate the start and end points of the entity you are hovering over. When hovering over a toolpath, the toolpath lines are thickened to distinguish it from other toolpaths. A blue arrow indicates the direction of the toolpath. A blue ball indicates the midpoint of an arc.
 Line/Arc/Drilling
When hovering over a line, arc, or drilling element of a toolpath the following will display:
- The entity is highlighted.
- Green and red arrow heads indicate the start and end points of the line.
- If the cursor is an endpoint, the tooltip will display the current XYZ Tplane or DZY Tplane coordinates.
When hovering over an element that is not an endpoint, a tooltip will display that is specific to the entity. See below for individual details.
For lines, it will display the operation number, if it is a feed or rapid move, spindle speed, G1 and the line length, and the coolant code.
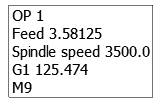
For arcs, it will display the operation number, feed rate, spindle speed, CW/CCW code, Helix (if applicable), "R" and the arc radius, and the coolant code.

For drilling toolpaths, it will display the operation number, feed rate, spindle speed, G1 Drilling and the drill (tool diameter) and the coolant code.

For Multiaxis toolpaths, it will display the current XYZ vector orientation information in addition to the current XYZ mouse location.

How do I place and remove a tool or holder onto a toolpath?
When analyzing a toolpath, select either Display tool, Display holder, or both in the function panel, and then select the location you would like to place the tool or holder onto. Analyze Toolpath then pauses, allowing you to rotate around the screen to view the tool, the holder, and the part. Once you are satisfied, select the tool or holder again to place it in another location, or leave the function.
You can also select Shaded or Wireframe to change the display of the tool and holder.


