Ok, let's see the result: 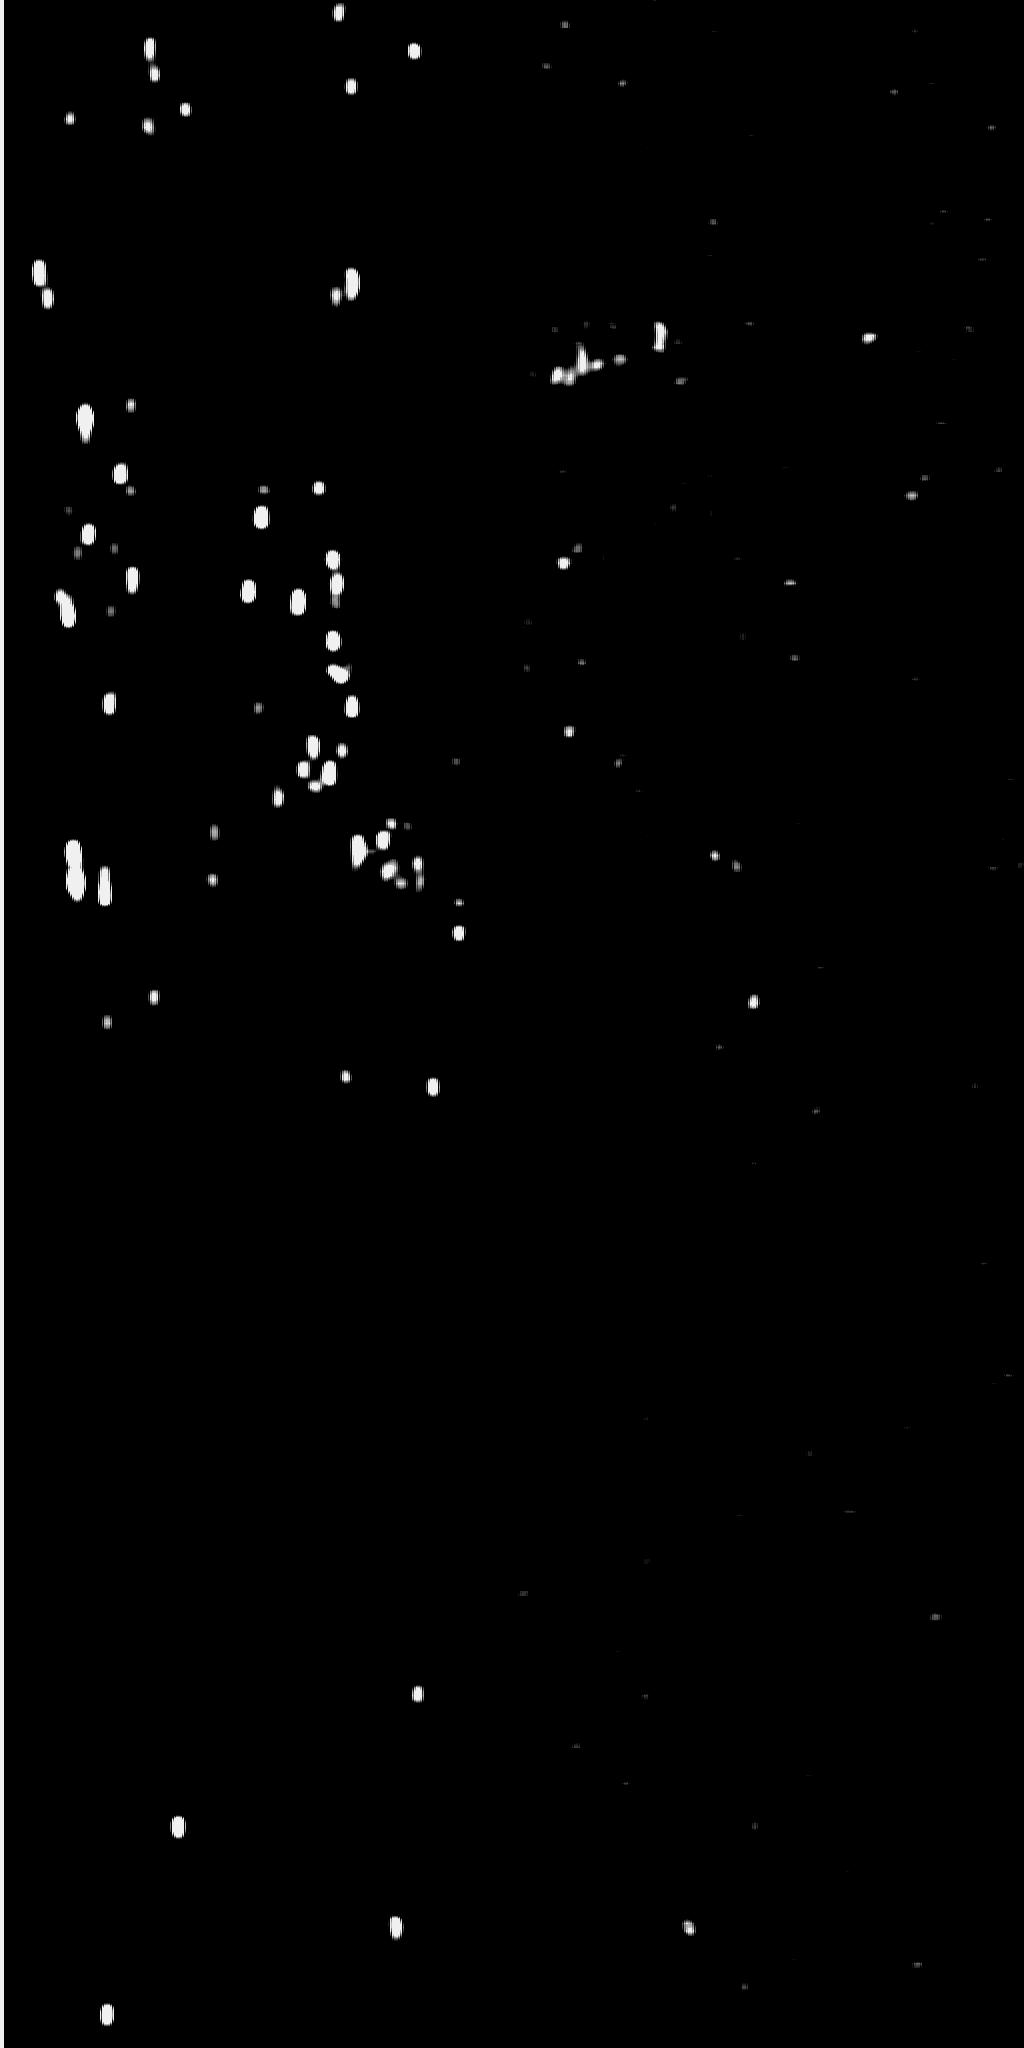
Eric Martin MBARI 2021
This assumes you've built the binaries in this directory, the goal of this notebook is to demonstrate the following:
To date the project has been collecting the data through a raw packet capture tool, tshark. We have written C tools to go through and parse these files into CSV files of interest for broader accessibility. Some sample data is present in the repository.
!ls -lh ../data/
total 1226336
-rw-r--r--  1 emartin  emartin   737B Oct  4 11:43 mbariAtSeaWecRadar_00315_202109
-rwxrwxrwx  1 emartin  emartin   200M Sep 28 17:20 mbariAtSeaWecRadar_00315_20210928171518.pcapng
-rwxrwxrwx@ 1 emartin  emartin   200M Sep 28 17:25 mbariAtSeaWecRadar_00316_20210928172018.pcapng
-rwxrwxrwx@ 1 emartin  emartin   200M Sep 30 14:20 mbariAtSeaWecRadar_00684_20210930000030.pcapng
We are pretty interested in the biggest day observed yet, 9/28/2021. Let's process that one. First let's process the radar data. The program, if built and installed should print out help with no inputs:
!pcaptoradar
Let's make sure there are data in the file:
!pcaptoradar -s ../data/mbariAtSeaWecRadar_00315_20210928171518.pcapng
Opening file: ../data/mbariAtSeaWecRadar_00315_20210928171518.pcapng
----------------
REPORTS_A: 300
REPORTS_B: 300
FRAMES_A:  11469
  SCANS:     367008
  REVS_A:    89
AHRS:      140896
----------------
Yes, there are reports data for both channels on the radar, and many Frames of sonar data, covering 367K radar scan lines, which add up to 89 full revolutions of the radar for the entire file.
Next, let's convert the reports, and just print the header:
!pcaptoradar -ah ../data/mbariAtSeaWecRadar_00315_20210928171518.pcapng | head -n4
Opening file: ../data/mbariAtSeaWecRadar_00315_20210928171518.pcapng
time,channel,range,gain,sea_auto,sea,rain,interference_rejection,target_expansion,target_boost
1632874519.070718,3,5000,60,0,25,0,0,1,1
1632874520.070762,3,5000,60,0,25,0,0,1,1
1632874521.070754,3,5000,60,0,25,0,0,1,1
We can see that this isn't changing, which is good, at the time of this analysis, there is little change happening on the radar setting, and all of these values make sense (but range is 500.0meters, so something is a bit off). If we wanted to make a file for all the reports we simply redirecto the stdout to a file, as so:
!pcaptoradar -ah ../data/mbariAtSeaWecRadar_00315_20210928171518.pcapng > reports_a.csv
Opening file: ../data/mbariAtSeaWecRadar_00315_20210928171518.pcapng
!ls -lh *.csv
-rw-r--r--  1 emartin  emartin   631K Oct  4 12:38 ahrs.csv
-rw-r--r--  1 emartin  emartin    12K Oct  5 09:48 reports_a.csv
-rw-r--r--  1 emartin  emartin   745M Oct  4 13:59 scans.csv
import pandas as pd
reports_df = pd.read_csv('reports_a.csv')
reports_df.head()
| time | channel | range | gain | sea_auto | sea | rain | interference_rejection | target_expansion | target_boost | |
|---|---|---|---|---|---|---|---|---|---|---|
| 0 | 1.632875e+09 | 3 | 5000 | 60 | 0 | 25 | 0 | 0 | 1 | 1 |
| 1 | 1.632875e+09 | 3 | 5000 | 60 | 0 | 25 | 0 | 0 | 1 | 1 |
| 2 | 1.632875e+09 | 3 | 5000 | 60 | 0 | 25 | 0 | 0 | 1 | 1 |
| 3 | 1.632875e+09 | 3 | 5000 | 60 | 0 | 25 | 0 | 0 | 1 | 1 |
| 4 | 1.632875e+09 | 3 | 5000 | 60 | 0 | 25 | 0 | 0 | 1 | 1 |
Much like the reports data, we can generate csv files using the pcaptoahrs tool.
!pcaptoahrs
ahrs lcm parser, usage pcaptoahrs <pcap filename>
	options: -h (enable csv header)
!pcaptoahrs -h ../data/mbariAtSeaWecRadar_00315_20210928171518.pcapng | head -n2
Opening file: ../data/mbariAtSeaWecRadar_00315_20210928171518.pcapng
pcap_time,lcm_time,latitude,longitude,yaw_true,pitch,roll,x_accel,y_accel,z_accel,n_velocity,e_velocity,d_velocity,altitude,x_rate,y_rate,z_rate, x_rate_temp,
1632874518.862951,1632874518.862882,36.743080139160156,-121.881141662597656,140.372314,-1.356812,-0.747070,0.074768,0.059814,-0.993958,0.171875,-0.132812,-0.507812,-33.750000,6.517639,-0.134583,1.038208,24.157715,
!pcaptoahrs -h ../data/mbariAtSeaWecRadar_00315_20210928171518.pcapng > ahrs.csv
Opening file: ../data/mbariAtSeaWecRadar_00315_20210928171518.pcapng
!ls -lh *.csv
-rw-r--r--  1 emartin  emartin   631K Oct  5 13:04 ahrs.csv
-rw-r--r--  1 emartin  emartin    12K Oct  5 09:48 reports_a.csv
-rw-r--r--  1 emartin  emartin   745M Oct  4 13:59 scans.csv
import pandas as pd
ahrs_df = pd.read_csv('ahrs.csv')
ahrs_df.head()
| pcap_time | lcm_time | latitude | longitude | yaw_true | pitch | roll | x_accel | y_accel | z_accel | n_velocity | e_velocity | d_velocity | altitude | x_rate | y_rate | z_rate | x_rate_temp | Unnamed: 18 | |
|---|---|---|---|---|---|---|---|---|---|---|---|---|---|---|---|---|---|---|---|
| 0 | 1.632875e+09 | 1.632875e+09 | 36.743080 | -121.881142 | 140.372314 | -1.356812 | -0.747070 | 0.074768 | 0.059814 | -0.993958 | 0.171875 | -0.132812 | -0.507812 | -33.75 | 6.517639 | -0.134583 | 1.038208 | 24.157715 | NaN |
| 1 | 1.632875e+09 | 1.632875e+09 | 36.743080 | -121.881142 | 140.460205 | -1.444702 | -0.126343 | 0.092773 | 0.031433 | -1.018982 | 0.062500 | -0.093750 | -0.515625 | -33.75 | 5.787048 | -1.538086 | 1.018982 | 24.157715 | NaN |
| 2 | 1.632875e+09 | 1.632875e+09 | 36.743084 | -121.881142 | 140.537109 | -1.713867 | 0.302124 | 0.097656 | 0.003357 | -1.034851 | 0.031250 | 0.007812 | -0.539062 | -33.75 | 3.441467 | -3.595276 | 0.826721 | 24.154663 | NaN |
| 3 | 1.632875e+09 | 1.632875e+09 | 36.743084 | -121.881142 | 140.603027 | -2.208252 | 0.532837 | 0.084229 | -0.025635 | -1.043701 | -0.054688 | 0.093750 | -0.578125 | -33.75 | 1.134338 | -5.902405 | 0.596008 | 24.151611 | NaN |
| 4 | 1.632875e+09 | 1.632875e+09 | 36.743084 | -121.881142 | 140.668945 | -2.861938 | 0.499878 | 0.058899 | -0.046997 | -1.060486 | -0.007812 | 0.148438 | -0.578125 | -33.50 | -1.345825 | -7.286682 | 0.730591 | 24.151611 | NaN |
Our last pcap file process is to take the file, restructure the packets, and turn it into something we can parse in in a higher level language, like python:
!pcaptoradar -AH ../data/mbariAtSeaWecRadar_00315_20210928171518.pcapng > scans.csv
Opening file: ../data/mbariAtSeaWecRadar_00315_20210928171518.pcapng
That took a while, but now we have the file in CSV form, let's take a look at how large it ended up.
!ls -lh *.csv
-rw-r--r--  1 emartin  emartin   631K Oct  4 12:38 ahrs.csv
-rw-r--r--  1 emartin  emartin    12K Oct  4 12:33 reports_a.csv
-rw-r--r--  1 emartin  emartin   745M Oct  4 13:59 scans.csv
So in the end, from a 200MB file, we are generating another file that is 745MB. Let's see if we can parse the file with pandas, and then the fun can begin.
import pandas as pd
#Set the dtypes to improve memory performance on import
dtypes_scans = {'time':'float',
                'channel':'string',
                'scan_line':'uint16',
                'heading':'int32',
                'angle':'uint16',
                'angle_d':'float',
                'range':'uint16',
               }
for i in range(1024):
    colname = f'r{i:04}'
    dtypes_scans[colname]='uint8'
%%time
df_scans = pd.read_csv('scans.csv', dtype=dtypes_scans)
CPU times: user 20 s, sys: 916 ms, total: 20.9 s
Wall time: 20.9 s
df_scans.tail()
| time | channel | scan_line | heading | angle | angle_d | range | r0000 | r0001 | r0002 | ... | r1015 | r1016 | r1017 | r1018 | r1019 | r1020 | r1021 | r1022 | r1023 | Unnamed: 1031 | |
|---|---|---|---|---|---|---|---|---|---|---|---|---|---|---|---|---|---|---|---|---|---|
| 367003 | 1.632875e+09 | A | 444 | -32768 | 89 | 7.822266 | 808 | 15 | 15 | 15 | ... | 0 | 0 | 0 | 0 | 0 | 0 | 0 | 0 | 0 | NaN |
| 367004 | 1.632875e+09 | A | 445 | -32768 | 91 | 7.998047 | 808 | 15 | 15 | 15 | ... | 0 | 0 | 0 | 0 | 0 | 0 | 0 | 0 | 0 | NaN |
| 367005 | 1.632875e+09 | A | 446 | -32768 | 93 | 8.173828 | 808 | 15 | 15 | 15 | ... | 0 | 0 | 0 | 0 | 0 | 0 | 0 | 0 | 0 | NaN |
| 367006 | 1.632875e+09 | A | 447 | -32768 | 95 | 8.349609 | 808 | 15 | 15 | 15 | ... | 0 | 0 | 0 | 0 | 0 | 0 | 0 | 0 | 0 | NaN |
| 367007 | 1.632875e+09 | A | 448 | -32768 | 97 | 8.525391 | 808 | 15 | 15 | 15 | ... | 0 | 0 | 0 | 0 | 0 | 0 | 0 | 0 | 0 | NaN |
5 rows × 1032 columns
df_scans.info()
<class 'pandas.core.frame.DataFrame'>
RangeIndex: 367008 entries, 0 to 367007
Columns: 1032 entries, time to Unnamed: 1031
dtypes: float64(3), int32(1), string(1), uint16(3), uint8(1024)
memory usage: 373.1 MB
df_scans.time.iloc[-1]
1632874818.762966
Let's find the first full revolution, scan_line set to 0.
# Get the first full scan
idx = df_scans.index[df_scans['angle'] == 1].to_list()
scan = df_scans.loc[idx[40]:idx[41]-1]
scan.info()
<class 'pandas.core.frame.DataFrame'>
RangeIndex: 2048 entries, 82287 to 84334
Columns: 1032 entries, time to Unnamed: 1031
dtypes: float64(3), int32(1), string(1), uint16(3), uint8(1024)
memory usage: 2.1 MB
Good! there are 2048 scans in one full revolution, we have something to look at.
from PIL import Image as im
import numpy as np
# Get an uint8 array from the scans
scan_data = scan.iloc[:, 7:-1].to_numpy()*16
max_scan = np.amax(scan_data)
print(max_scan)
240
image_ = im.fromarray(scan_data)
image_.save('scan_nonpolar.jpg')
Ok, let's see the result:
The final step in creating a monochrome image is to reshape the array into a cartesian one. At the end of the day, we should have a square bound by the radius of the spokes, or $2*(1024)=2048$. Let's take a brute force attempt at this.
#create an array to pack
cart = np.zeros((2048,2048),dtype='uint8')
# def a remapping function
def map_polar(angle,length, max_angle=2048, max_length=1024):
    '''
        angle in decimal degrees
        length of array to output

        returns -- x and y arrays for index mapping
    '''
    ANG2RAD = 2*np.pi/max_angle
    x = length * np.cos(angle*ANG2RAD)
    y = length * np.sin(angle*ANG2RAD)

    ## shift into positive spaces
    x = np.round(x)
    y = np.round(y)
    x += max_length
    y += max_length
    return (int(x),int(y))

map_polar(1024,1024)
(0, 1024)
# Super stupidly, let's go line by line and write over the data for the one before
it = np.nditer(scan_data, flags=['multi_index'])
for x in it:
    if x == 0:
        continue
    r,c = it.multi_index
    crow,ccol = map_polar(r,c)
    cart[crow,ccol] = x
# make an image from the cartesian converted array
cart_img = im.fromarray(cart)
cart_img.save('scan_polar.jpg')
Here is the result 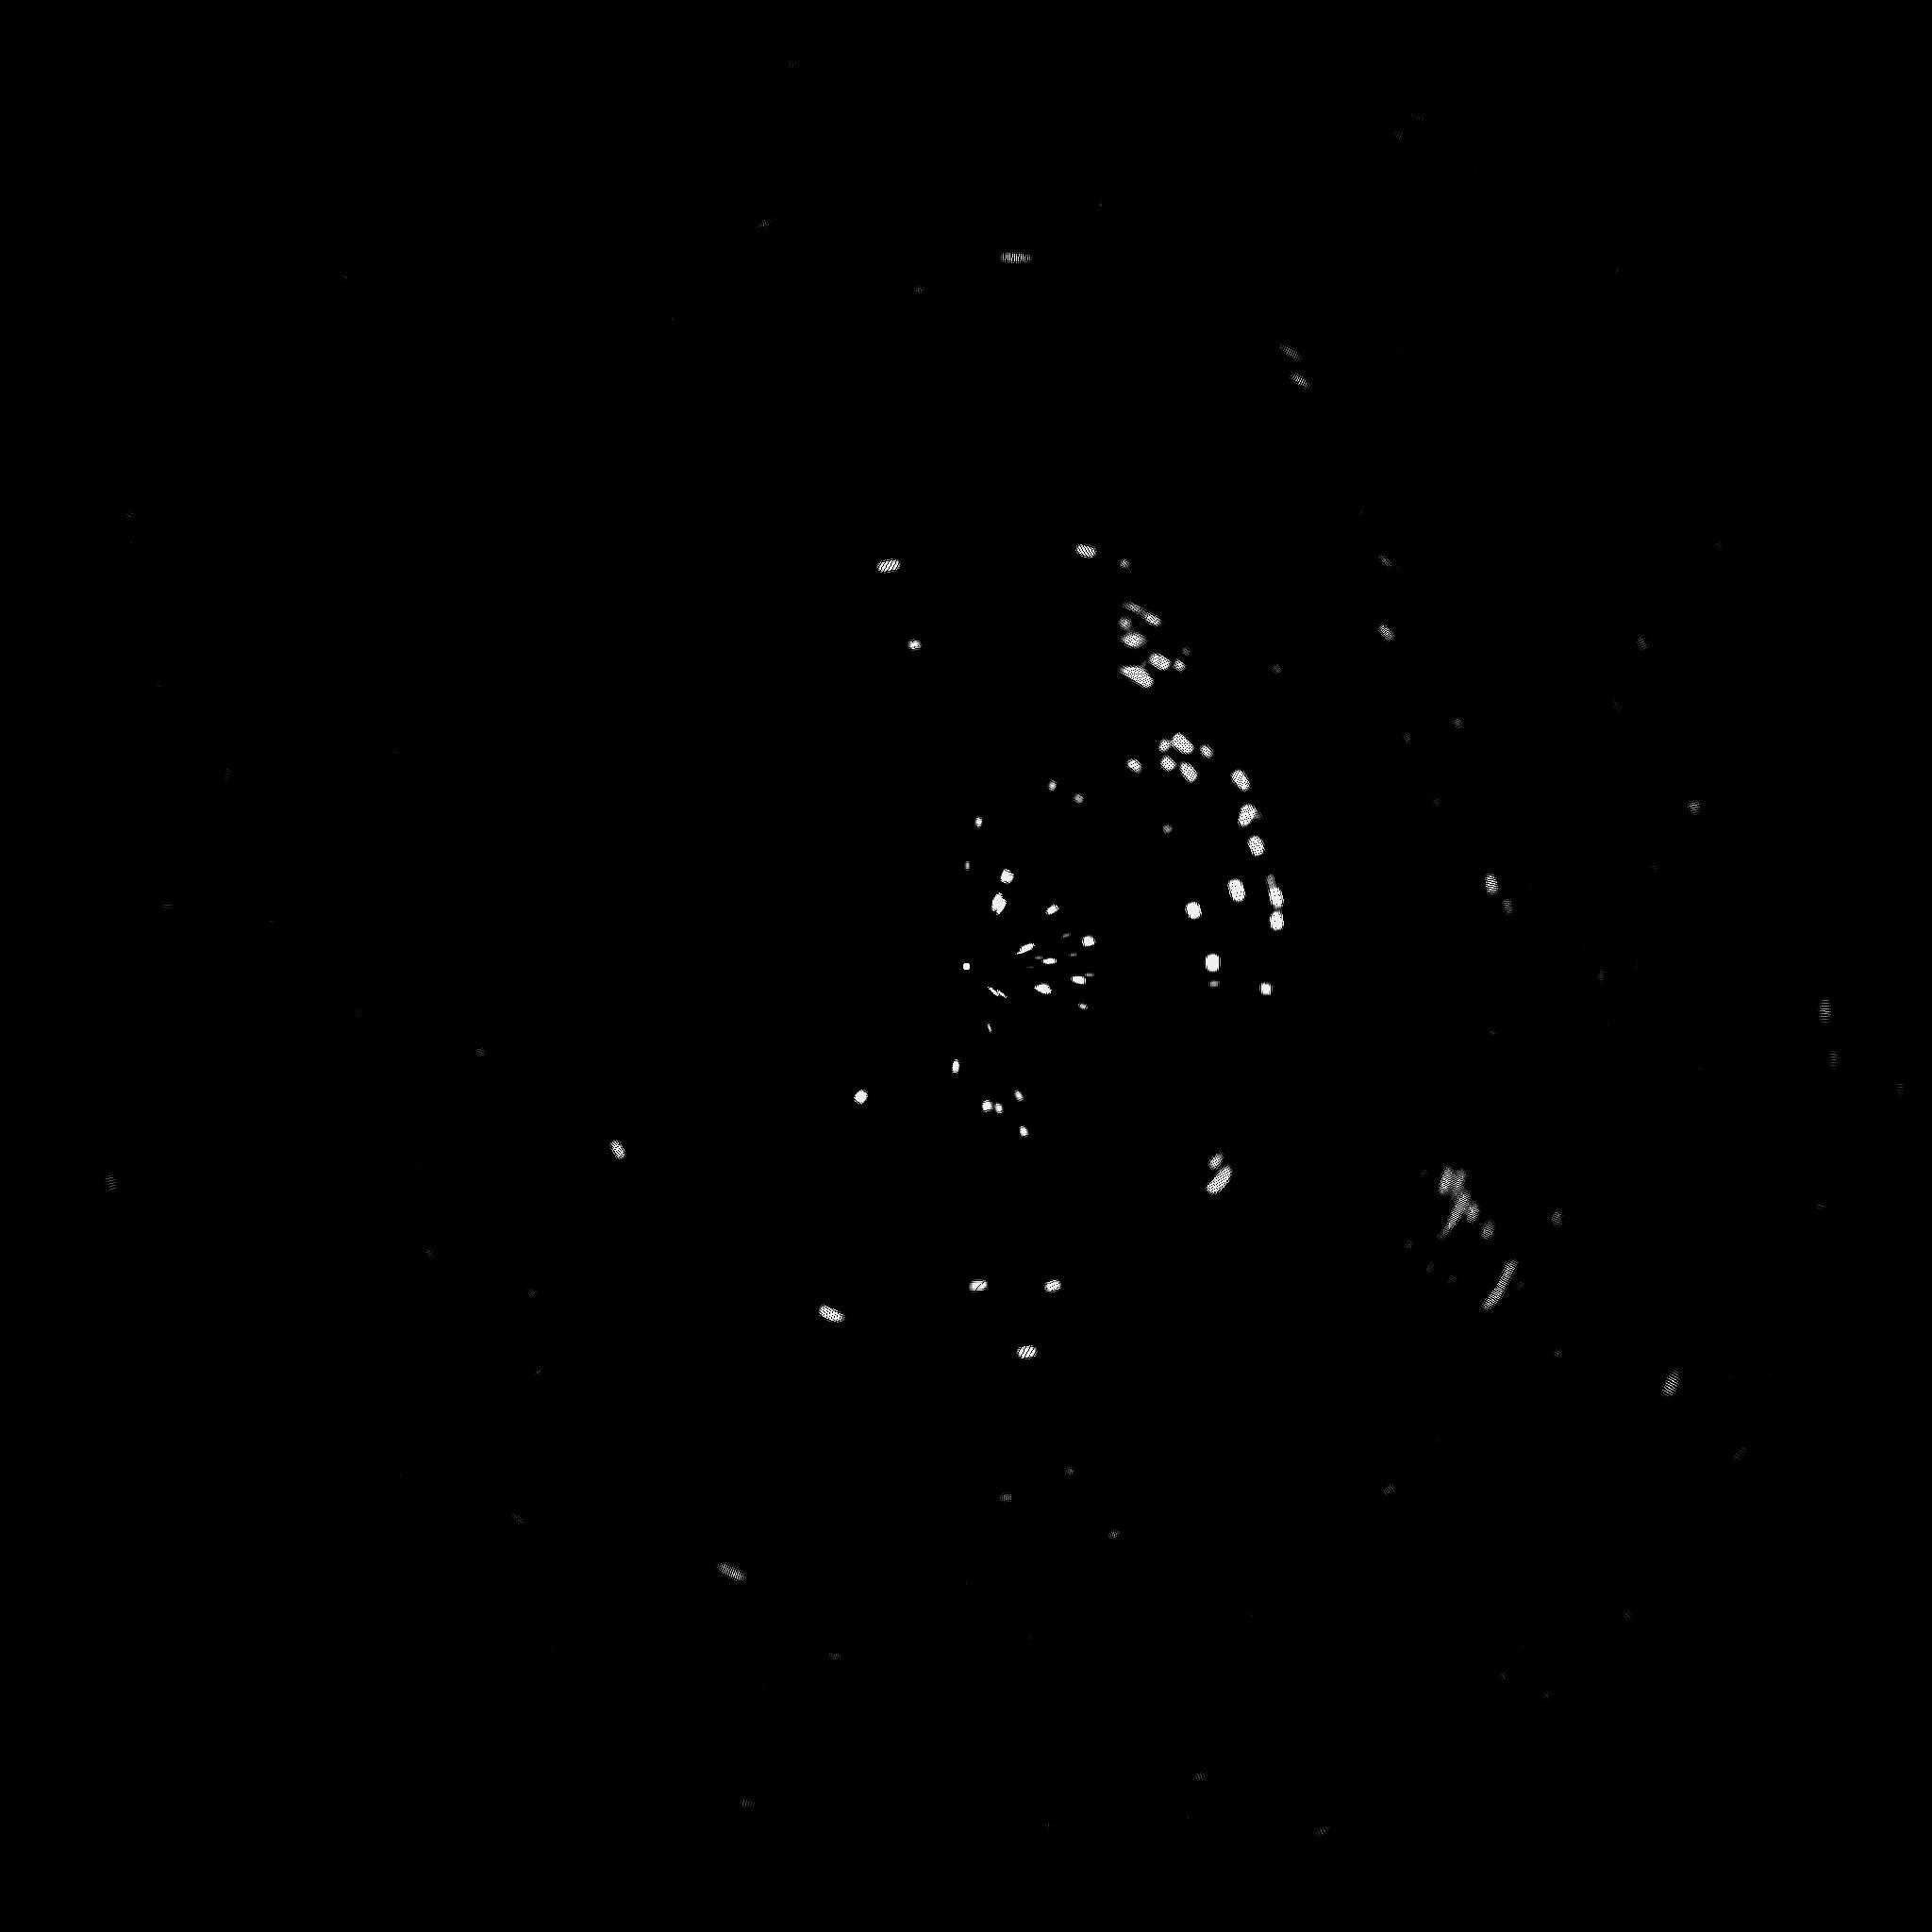
ls -lh
total 1561664
-rw-r--r--@   1 emartin  emartin   617K Oct  5 12:50 Radar Image Data Exploration.html
-rw-r--r--    1 emartin  emartin    48K Oct  5 13:12 Radar Image Data Exploration.ipynb
-rw-r--r--    1 emartin  emartin   631K Oct  5 13:04 ahrs.csv
drwxr-xr-x  361 emartin  emartin    11K Oct  5 00:07 img/
-rw-r--r--    1 emartin  emartin   8.9M Oct  5 09:40 output.mp4
-rw-r--r--    1 emartin  emartin    12K Oct  5 09:48 reports_a.csv
-rw-r--r--    1 emartin  emartin    61K Oct  5 13:13 scan_nonpolar.jpg
-rw-r--r--    1 emartin  emartin    98K Oct  5 13:13 scan_polar.jpg
-rw-r--r--    1 emartin  emartin   745M Oct  4 13:59 scans.csv
-rw-r--r--    1 emartin  emartin   4.0K Oct  5 13:10 wec_radar_movie.py
Just a little sandbox area for me to sort out the best way to get a single yaw offset for the whole revolution.
start_t = scan.time.iloc[0]
end_t = scan.time.iloc[-1]
print(start_t, end_t, end_t-start_t)
1632874586.014958 1632874587.689166 1.674208164215088
ahrs_df.info()
<class 'pandas.core.frame.DataFrame'>
RangeIndex: 3005 entries, 0 to 3004
Data columns (total 19 columns):
 #   Column        Non-Null Count  Dtype
---  ------        --------------  -----
 0   pcap_time     3005 non-null   float64
 1   lcm_time      3005 non-null   float64
 2   latitude      3005 non-null   float64
 3   longitude     3005 non-null   float64
 4   yaw_true      3005 non-null   float64
 5   pitch         3005 non-null   float64
 6   roll          3005 non-null   float64
 7   x_accel       3005 non-null   float64
 8   y_accel       3005 non-null   float64
 9   z_accel       3005 non-null   float64
 10  n_velocity    3005 non-null   float64
 11  e_velocity    3005 non-null   float64
 12  d_velocity    3005 non-null   float64
 13  altitude      3005 non-null   float64
 14  x_rate        3005 non-null   float64
 15  y_rate        3005 non-null   float64
 16  z_rate        3005 non-null   float64
 17   x_rate_temp  3005 non-null   float64
 18  Unnamed: 18   0 non-null      float64
dtypes: float64(19)
memory usage: 446.2 KB
scan_angles = ahrs_df.loc[(ahrs_df.lcm_time >= start_t) & (ahrs_df.lcm_time <=end_t)]
scan_angles.yaw_true.describe()
type(scan_angles.yaw_true.mean())
numpy.float64
10+None
---------------------------------------------------------------------------
TypeError                                 Traceback (most recent call last)
<ipython-input-71-7364e94b6574> in <module>
----> 1 10+None

TypeError: unsupported operand type(s) for +: 'int' and 'NoneType'
Let's turn this into and full script, here are the contents of wec_radar_movie.py file subject to change:
!cat wec_radar_movie.py
import numpy as np
import pandas as pd
from pandas.core.frame import DataFrame


class RadarScans():

    def __init__(self, csvfile:str, ahrs_csv:str = 'None', mode='cartesian'):
        print(f"opening file: {csvfile}")
        self.scan_df = RadarScans.open_csv_file(csvfile)
        self.ahrs_df = RadarScans.open_ahrs_file(ahrs_csv)
        self.initialize_scan_indexes()
        self.mode=mode

    def open_csv_file(csvfile:str):
        dtypes_scans = {'time':'float',
                'channel':'string',
                'scan_line':'uint16',
                'heading':'int32',
                'angle':'uint16',
                'angle_d':'float',
                'range':'uint16',
               }
        for i in range(1024):
            colname = f'r{i:04}'
            dtypes_scans[colname]='uint8'

        scan_df = pd.read_csv(csvfile, dtype=dtypes_scans)
        return scan_df

    def open_ahrs_file(csvfile):
        ahrs_df = pd.read_csv(csvfile)
        return ahrs_df

    def initialize_scan_indexes(self):
        self.indexes = self.scan_df.index[self.scan_df['angle']==1].to_list()
        self.num_scans = len(self.indexes)-1
        print(f'found {self.num_scans} full revolutions in file.')


    def select_scan(self, n:int):
        if (n >= self.num_scans):
            return None;

        idx = self.indexes
        scan = self.scan_df.loc[idx[n]:idx[n+1]-1]
        return scan

    def scan_angle_offset(self, scan:DataFrame):

        # Guard against uninitialized access
        if self.ahrs_df is None:
            raise Exception('No AHRS data present')

        # Find the bounds of the time window
        start_t = scan.time.iloc[0]
        end_t = scan.time.iloc[-1]

        yaw_true_mean = self.ahrs_df.loc[(self.ahrs_df.lcm_time >= start_t) & (self.ahrs_df.lcm_time <=end_t)].yaw_true.mean();
        return yaw_true_mean


    def convert_to_polar(self, scan, scan_df,  returns_per_scanline=1024):

        #create an array to pack
        out = np.zeros((2*returns_per_scanline,2*returns_per_scanline),dtype='uint8')
        it = np.nditer(scan, flags=['multi_index'])
        if self.ahrs_df is None:
            yaw_angle=0
        else:
            yaw_angle = self.scan_angle_offset(scan_df)
        for x in it:
            r,c = it.multi_index
            if x == 0:
                continue
            crow,ccol = RadarScans.map_polar(r,c, yaw=yaw_angle)
            out[crow,ccol] = x
        return out

    def map_polar(angle,length, yaw=0, max_angle=2048, max_length=1024):
        '''
            angle in integer representaion, scaled by Max_angle (default 0-2048)
            length of array to output

            returns -- x and y arrays for index mapping
        '''
        DEG2RAD = np.pi/180
        ANG2RAD = 2*np.pi/max_angle
        f_angle = ANG2RAD*angle
        f_angle += yaw*DEG2RAD
        x = length * np.cos(f_angle)
        y = length * np.sin(f_angle)

        ## shift into positive spaces
        x = np.round(x)
        y = np.round(y)
        x += max_length
        y += max_length
        return (int(x),int(y))

    def __iter__(self):
        self.current_scan = 0
        return self

    def __next__(self):
        """Returns a ndarray of uint8 that can be used for image/movie conversion
        """
        scan =self.select_scan(self.current_scan)
        if scan is None:
            raise StopIteration

        out = scan.iloc[:, 7:-1].to_numpy()*16
        if self.mode == 'polar':
            out = self.convert_to_polar(out, scan)


        self.current_scan += 1
        return out

if __name__ == '__main__':
    from PIL import Image

    fname = 'scans.csv'
    scanner = RadarScans(fname, ahrs_csv='ahrs.csv', mode='polar')

    cnt = 0

    for scan in scanner:
        image = Image.fromarray(scan)
        im_name = f'./img/scan_pa_{cnt:04}.jpg'
        print(f'Writing image: {im_name}...')
        image.save(im_name)
        cnt+=1
Now we have a set of images that we can turn into a movie. There are many ways to achieve this task, for now we will use ffmpeg.
!ffmpeg -framerate 12 -i ./img/scan_p_%04d.jpg -vf format=yuv420p output.mp4
ffmpeg version 4.4 Copyright (c) 2000-2021 the FFmpeg developers
  built with Apple clang version 12.0.0 (clang-1200.0.32.29)
  configuration: --prefix=/usr/local/Cellar/ffmpeg/4.4_2 --enable-shared --enable-pthreads --enable-version3 --cc=clang --host-cflags= --host-ldflags= --enable-ffplay --enable-gnutls --enable-gpl --enable-libaom --enable-libbluray --enable-libdav1d --enable-libmp3lame --enable-libopus --enable-librav1e --enable-librubberband --enable-libsnappy --enable-libsrt --enable-libtesseract --enable-libtheora --enable-libvidstab --enable-libvorbis --enable-libvpx --enable-libwebp --enable-libx264 --enable-libx265 --enable-libxml2 --enable-libxvid --enable-lzma --enable-libfontconfig --enable-libfreetype --enable-frei0r --enable-libass --enable-libopencore-amrnb --enable-libopencore-amrwb --enable-libopenjpeg --enable-libspeex --enable-libsoxr --enable-libzmq --enable-libzimg --disable-libjack --disable-indev=jack --enable-avresample --enable-videotoolbox
  libavutil      56. 70.100 / 56. 70.100
  libavcodec     58.134.100 / 58.134.100
  libavformat    58. 76.100 / 58. 76.100
  libavdevice    58. 13.100 / 58. 13.100
  libavfilter     7.110.100 /  7.110.100
  libavresample   4.  0.  0 /  4.  0.  0
  libswscale      5.  9.100 /  5.  9.100
  libswresample   3.  9.100 /  3.  9.100
  libpostproc    55.  9.100 / 55.  9.100
Input #0, image2, from './img/scan_p_%04d.jpg':
  Duration: 00:00:14.92, start: 0.000000, bitrate: N/A
  Stream #0:0: Video: mjpeg (Baseline), gray(bt470bg/unknown/unknown), 2048x2048 [SAR 1:1 DAR 1:1], 12 fps, 12 tbr, 12 tbn, 12 tbc
Stream mapping:
  Stream #0:0 -> #0:0 (mjpeg (native) -> h264 (libx264))
Press [q] to stop, [?] for help
[libx264 @ 0x7fcc0c008e00] using SAR=1/1
[libx264 @ 0x7fcc0c008e00] using cpu capabilities: MMX2 SSE2Fast SSSE3 SSE4.2 AVX FMA3 BMI2 AVX2
[libx264 @ 0x7fcc0c008e00] profile High, level 5.0, 4:2:0, 8-bit
[libx264 @ 0x7fcc0c008e00] 264 - core 163 r3060 5db6aa6 - H.264/MPEG-4 AVC codec - Copyleft 2003-2021 - http://www.videolan.org/x264.html - options: cabac=1 ref=3 deblock=1:0:0 analyse=0x3:0x113 me=hex subme=7 psy=1 psy_rd=1.00:0.00 mixed_ref=1 me_range=16 chroma_me=1 trellis=1 8x8dct=1 cqm=0 deadzone=21,11 fast_pskip=1 chroma_qp_offset=-2 threads=24 lookahead_threads=4 sliced_threads=0 nr=0 decimate=1 interlaced=0 bluray_compat=0 constrained_intra=0 bframes=3 b_pyramid=2 b_adapt=1 b_bias=0 direct=1 weightb=1 open_gop=0 weightp=2 keyint=250 keyint_min=12 scenecut=40 intra_refresh=0 rc_lookahead=40 rc=crf mbtree=1 crf=23.0 qcomp=0.60 qpmin=0 qpmax=69 qpstep=4 ip_ratio=1.40 aq=1:1.00
Output #0, mp4, to 'output.mp4':
  Metadata:
    encoder         : Lavf58.76.100
  Stream #0:0: Video: h264 (avc1 / 0x31637661), yuv420p(tv, bt470bg/unknown/unknown, progressive), 2048x2048 [SAR 1:1 DAR 1:1], q=2-31, 12 fps, 12288 tbn
    Metadata:
      encoder         : Lavc58.134.100 libx264
    Side data:
      cpb: bitrate max/min/avg: 0/0/0 buffer size: 0 vbv_delay: N/A
frame=  179 fps= 44 q=-1.0 Lsize=    9146kB time=00:00:14.66 bitrate=5108.4kbits/s speed=3.63x
video:9143kB audio:0kB subtitle:0kB other streams:0kB global headers:0kB muxing overhead: 0.032609%
[libx264 @ 0x7fcc0c008e00] frame I:16    Avg QP:17.88  size: 88040
[libx264 @ 0x7fcc0c008e00] frame P:55    Avg QP:24.82  size: 46904
[libx264 @ 0x7fcc0c008e00] frame B:108   Avg QP:25.82  size: 49754
[libx264 @ 0x7fcc0c008e00] consecutive B-frames: 15.6%  6.7% 15.1% 62.6%
[libx264 @ 0x7fcc0c008e00] mb I  I16..4: 18.3% 75.9%  5.8%
[libx264 @ 0x7fcc0c008e00] mb P  I16..4:  0.3% 10.4%  3.7%  P16..4:  1.4%  0.3%  0.1%  0.0%  0.0%    skip:83.8%
[libx264 @ 0x7fcc0c008e00] mb B  I16..4:  0.1%  1.4%  3.0%  B16..8: 14.1%  0.9%  0.3%  direct: 0.3%  skip:79.8%  L0:50.8% L1:48.1% BI: 1.1%
[libx264 @ 0x7fcc0c008e00] 8x8 transform intra:67.2% inter:33.8%
[libx264 @ 0x7fcc0c008e00] coded y,uvDC,uvAC intra: 19.6% 0.0% 0.0% inter: 1.4% 0.0% 0.0%
[libx264 @ 0x7fcc0c008e00] i16 v,h,dc,p: 88%  7%  5%  0%
[libx264 @ 0x7fcc0c008e00] i8 v,h,dc,ddl,ddr,vr,hd,vl,hu: 51%  6% 39%  1%  1%  1%  1%  1%  1%
[libx264 @ 0x7fcc0c008e00] i4 v,h,dc,ddl,ddr,vr,hd,vl,hu: 19% 13% 38%  6%  5%  6%  5%  5%  4%
[libx264 @ 0x7fcc0c008e00] i8c dc,h,v,p: 100%  0%  0%  0%
[libx264 @ 0x7fcc0c008e00] Weighted P-Frames: Y:0.0% UV:0.0%
[libx264 @ 0x7fcc0c008e00] ref P L0: 68.6%  1.4% 21.7%  8.3%
[libx264 @ 0x7fcc0c008e00] ref B L0: 82.0% 15.8%  2.2%
[libx264 @ 0x7fcc0c008e00] ref B L1: 95.1%  4.9%
[libx264 @ 0x7fcc0c008e00] kb/s:5020.83
from IPython.display import Video
Video('output.mp4', width=400)
!ffmpeg -framerate 12 -i ./img/scan_pa_%04d.jpg -vf format=yuv420p output_corrected.mp4
ffmpeg version 4.4 Copyright (c) 2000-2021 the FFmpeg developers
  built with Apple clang version 12.0.0 (clang-1200.0.32.29)
  configuration: --prefix=/usr/local/Cellar/ffmpeg/4.4_2 --enable-shared --enable-pthreads --enable-version3 --cc=clang --host-cflags= --host-ldflags= --enable-ffplay --enable-gnutls --enable-gpl --enable-libaom --enable-libbluray --enable-libdav1d --enable-libmp3lame --enable-libopus --enable-librav1e --enable-librubberband --enable-libsnappy --enable-libsrt --enable-libtesseract --enable-libtheora --enable-libvidstab --enable-libvorbis --enable-libvpx --enable-libwebp --enable-libx264 --enable-libx265 --enable-libxml2 --enable-libxvid --enable-lzma --enable-libfontconfig --enable-libfreetype --enable-frei0r --enable-libass --enable-libopencore-amrnb --enable-libopencore-amrwb --enable-libopenjpeg --enable-libspeex --enable-libsoxr --enable-libzmq --enable-libzimg --disable-libjack --disable-indev=jack --enable-avresample --enable-videotoolbox
  libavutil      56. 70.100 / 56. 70.100
  libavcodec     58.134.100 / 58.134.100
  libavformat    58. 76.100 / 58. 76.100
  libavdevice    58. 13.100 / 58. 13.100
  libavfilter     7.110.100 /  7.110.100
  libavresample   4.  0.  0 /  4.  0.  0
  libswscale      5.  9.100 /  5.  9.100
  libswresample   3.  9.100 /  3.  9.100
  libpostproc    55.  9.100 / 55.  9.100
Input #0, image2, from './img/scan_pa_%04d.jpg':
  Duration: 00:00:14.92, start: 0.000000, bitrate: N/A
  Stream #0:0: Video: mjpeg (Baseline), gray(bt470bg/unknown/unknown), 2048x2048 [SAR 1:1 DAR 1:1], 12 fps, 12 tbr, 12 tbn, 12 tbc
Stream mapping:
  Stream #0:0 -> #0:0 (mjpeg (native) -> h264 (libx264))
Press [q] to stop, [?] for help
[libx264 @ 0x7fc933808e00] using SAR=1/1
[libx264 @ 0x7fc933808e00] using cpu capabilities: MMX2 SSE2Fast SSSE3 SSE4.2 AVX FMA3 BMI2 AVX2
[libx264 @ 0x7fc933808e00] profile High, level 5.0, 4:2:0, 8-bit
[libx264 @ 0x7fc933808e00] 264 - core 163 r3060 5db6aa6 - H.264/MPEG-4 AVC codec - Copyleft 2003-2021 - http://www.videolan.org/x264.html - options: cabac=1 ref=3 deblock=1:0:0 analyse=0x3:0x113 me=hex subme=7 psy=1 psy_rd=1.00:0.00 mixed_ref=1 me_range=16 chroma_me=1 trellis=1 8x8dct=1 cqm=0 deadzone=21,11 fast_pskip=1 chroma_qp_offset=-2 threads=24 lookahead_threads=4 sliced_threads=0 nr=0 decimate=1 interlaced=0 bluray_compat=0 constrained_intra=0 bframes=3 b_pyramid=2 b_adapt=1 b_bias=0 direct=1 weightb=1 open_gop=0 weightp=2 keyint=250 keyint_min=12 scenecut=40 intra_refresh=0 rc_lookahead=40 rc=crf mbtree=1 crf=23.0 qcomp=0.60 qpmin=0 qpmax=69 qpstep=4 ip_ratio=1.40 aq=1:1.00
Output #0, mp4, to 'output_corrected.mp4':
  Metadata:
    encoder         : Lavf58.76.100
  Stream #0:0: Video: h264 (avc1 / 0x31637661), yuv420p(tv, bt470bg/unknown/unknown, progressive), 2048x2048 [SAR 1:1 DAR 1:1], q=2-31, 12 fps, 12288 tbn
    Metadata:
      encoder         : Lavc58.134.100 libx264
    Side data:
      cpb: bitrate max/min/avg: 0/0/0 buffer size: 0 vbv_delay: N/A
frame=  179 fps= 45 q=-1.0 Lsize=    9171kB time=00:00:14.66 bitrate=5122.4kbits/s speed=3.72x
video:9168kB audio:0kB subtitle:0kB other streams:0kB global headers:0kB muxing overhead: 0.032349%
[libx264 @ 0x7fc933808e00] frame I:15    Avg QP:17.41  size: 86581
[libx264 @ 0x7fc933808e00] frame P:57    Avg QP:24.93  size: 49589
[libx264 @ 0x7fc933808e00] frame B:107   Avg QP:25.76  size: 49179
[libx264 @ 0x7fc933808e00] consecutive B-frames: 15.1% 10.1% 16.8% 58.1%
[libx264 @ 0x7fc933808e00] mb I  I16..4: 19.8% 74.5%  5.7%
[libx264 @ 0x7fc933808e00] mb P  I16..4:  0.3% 10.8%  4.0%  P16..4:  1.5%  0.3%  0.1%  0.0%  0.0%    skip:83.1%
[libx264 @ 0x7fc933808e00] mb B  I16..4:  0.1%  1.4%  3.0%  B16..8: 14.1%  0.9%  0.3%  direct: 0.3%  skip:80.0%  L0:50.9% L1:47.9% BI: 1.2%
[libx264 @ 0x7fc933808e00] 8x8 transform intra:66.4% inter:33.1%
[libx264 @ 0x7fc933808e00] coded y,uvDC,uvAC intra: 20.1% 0.0% 0.0% inter: 1.4% 0.0% 0.0%
[libx264 @ 0x7fc933808e00] i16 v,h,dc,p: 89%  7%  5%  0%
[libx264 @ 0x7fc933808e00] i8 v,h,dc,ddl,ddr,vr,hd,vl,hu: 49%  5% 41%  1%  1%  1%  1%  1%  1%
[libx264 @ 0x7fc933808e00] i4 v,h,dc,ddl,ddr,vr,hd,vl,hu: 19% 12% 40%  5%  5%  5%  5%  4%  4%
[libx264 @ 0x7fc933808e00] i8c dc,h,v,p: 100%  0%  0%  0%
[libx264 @ 0x7fc933808e00] Weighted P-Frames: Y:0.0% UV:0.0%
[libx264 @ 0x7fc933808e00] ref P L0: 70.3%  1.4% 21.2%  7.0%
[libx264 @ 0x7fc933808e00] ref B L0: 81.2% 16.7%  2.2%
[libx264 @ 0x7fc933808e00] ref B L1: 95.8%  4.2%
[libx264 @ 0x7fc933808e00] kb/s:5034.62
from IPython.display import Video
Video('output_corrected.mp4', width=400)