Log Tab
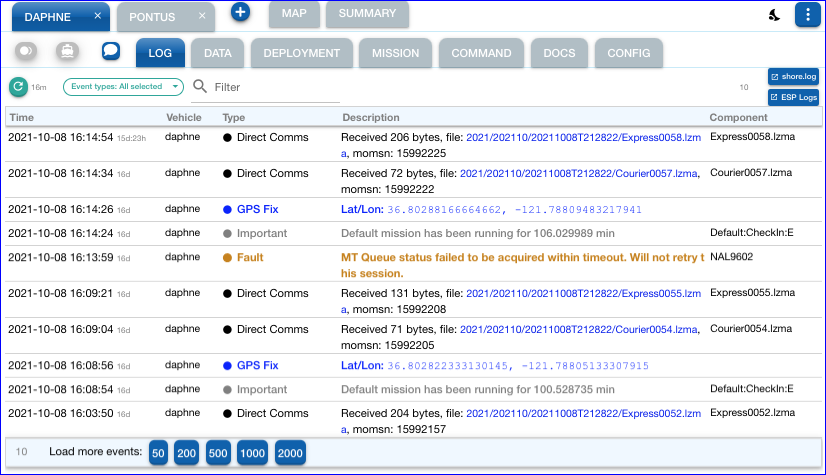
A Log tab is associated to each selected vehicle, and consists of the following main elements:
- Refresh button
- Event type selection
- Text filter
- Direct link to the
shore.logfile - Direct link to the ESP Logs directory
- Event table
- Buttons to load more events
Querying for Events
The set of events loaded by Dash4 for a given vehicle is the result of querying the TethysDash backend according to the following:
-
The parameter
Number of events to load per vehicle upon a refreshin the Query section of the Frontend Settings. This parameter just puts a limit on the maximum number of records to retrieve from the backend. -
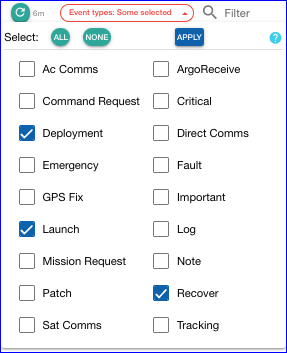
The query to the backend is also determined by the selected event types:
Note
This event type selection condition has been added in v4.7.5.
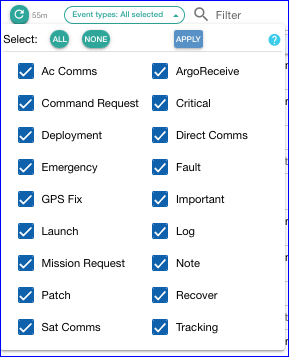
As exposed in the selection dropdown, most of the event types have a direct 1-to-1 correspondence to the basic event types defined in the system, while other entries comprise families of such types:
Direct Comms->Direct Comms ACK,Direct Comms ReceivedSat Comms->SAT Comms Request,SAT Comms Queued,SAT Comms Received.
Upon any desired changes in this selection,
use the Apply button to perform the updated request.
Type Esc or close the dropdown to cancel any changes.
Loading More Events
The buttons at the bottom of the table allow quickly loading more events from the backend and according to the current event type selection.
Note that any additional events loaded in this way will in principle remain loaded until the next regular refresh action (either explicit or via auto-refresh).
Tip
If you are using these buttons for more than just a quick inspection, you may want to temporarily disable the auto-refresh feature to avoid the potential "interference," while having better overall control.
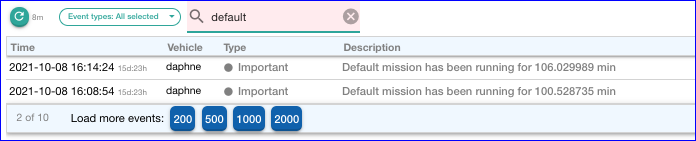
Filtering on the UI side
You can use the filter field to select a subset of the loaded events for actual display in the table according to the entered text.
Literal filtering
This is the traditional and default mode of filtering. In this mode the filtering checks if the given input is a (case-insensitive) substring of the description, component, or name of the event.
Advanced filtering
You can also enable other advanced filtering modes in the General section of the Frontend Settings:
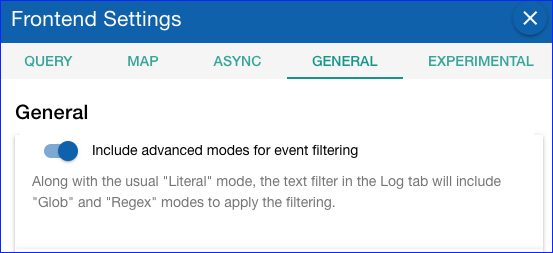
When enabled, the mode options will be included in the text field:
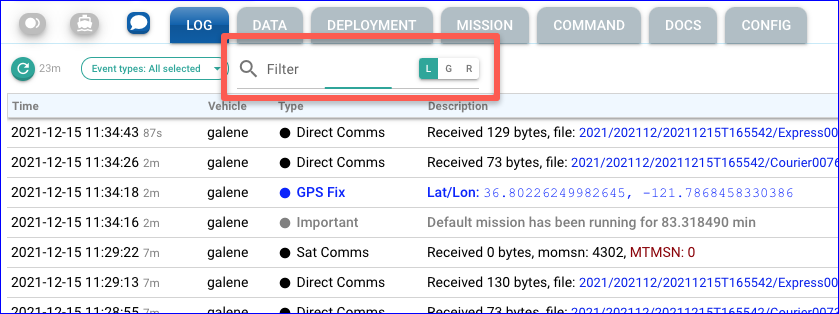
L: Literal filtering modeG: Glob filtering modeR: Regex filtering mode
Glob filtering
The "glob" mode
interprets the standard * and ? characters as denoting
"any sequence of characters" and "any single character", respectively.
These are applied to each of the event attributes: description, component, name.
Note that a glob search is matched against the whole contents of the attribute.
Examples:
-
triton*.sbd: attribute value starts withtritonand ends with.sbd. -
*PIC: attribute value ends inPIC.
Regex filtering
This mode applies a given regular expression for the filtering. As in the other modes, the match is applied to each of the event attributes: description, component, and name.
Examples:
-
sci2.(speed|NeedCommsTime): attribute value containssci2.speedorsci2.NeedCommsTime. -
hardware|timeout: attribute value containshardwareortimeout. -
^got: attribute value starts withgot. -
minute$: attribute value ends withminute.
Note that without the anchors ^ or $, the
filtering will apply the regex on any part of the attribute value.