Index
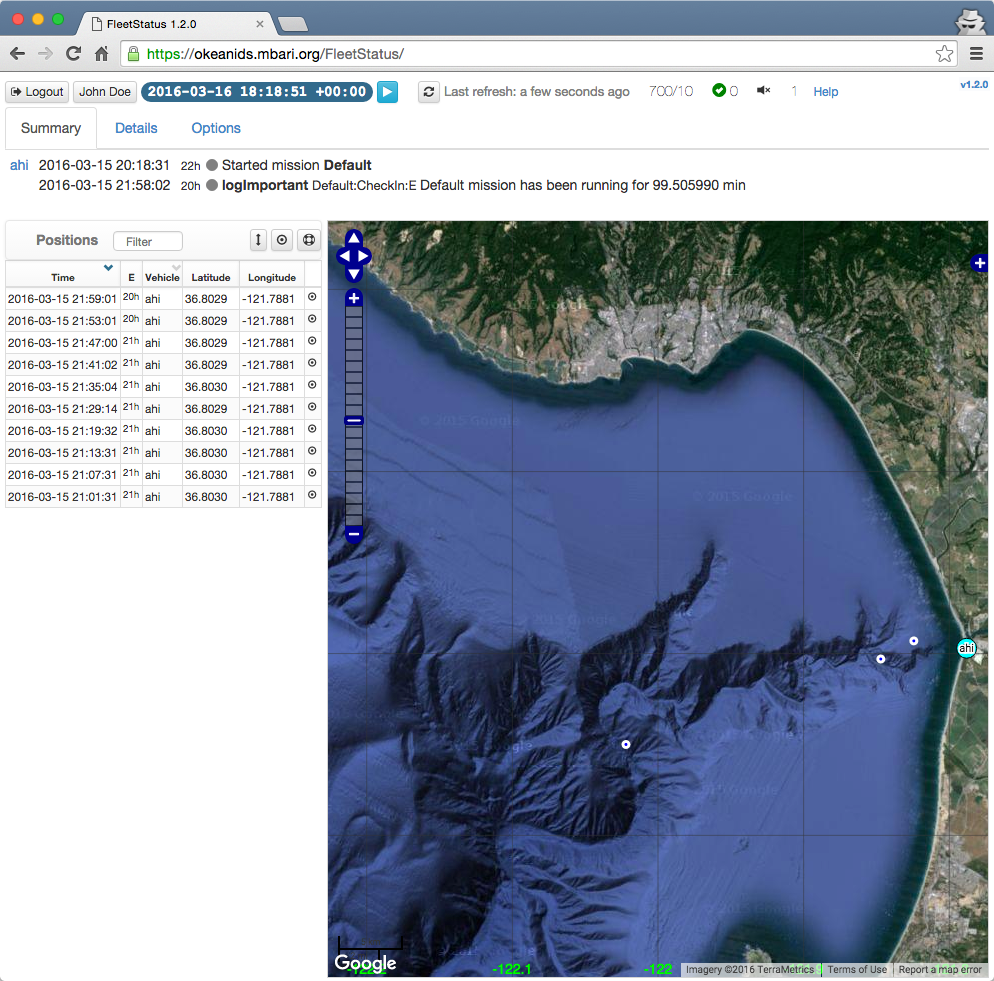
The FleetStatus UI facilitates browsing and visualizing the latest LRAUV vehicle events (including commands and collaboration notes) and positions as maintained and reported by the TethysDash backend service.
-
A header section includes:
- Login/logout button.
- User account button. This opens the main user account page.
- Current time. All times displayed in the application can be in the local timezone or in UTC. Click this widget to switch between these two options. For convenience, the displayed times in other parts of the user interface do not show the timezone offset.
- Playback button.
- A button to manually reload the information from the backend database.
- A text indicating the last time the displayed information was updated from the backend database.
- A string of the form "e/p" indicating the current number of loaded events and positions.
- An icon and a number indicating the status of the connection for asynchronous reception of notifications and number of received notifications.
- An icon indicating whether a sound is to be played whenever an asynchronous notification is received.
- Current number of operators on the system. (Admin users will be able to see the corresponding list.)
- Help link pointing to the main FleetStatus section in this documentation.
- Version link pointing to the FleetStatus change log section in the documentation.
The remaining of the interface is organized in three main sections or tabs: Summary, Details, and Options.
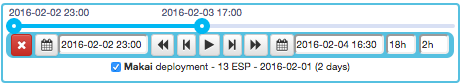
Playback
FleetStatus allows to play back any desired time period according to the selected vehicles in the Options tab, or any particular vehicle deployment.
Clicking the playback button in the header will show the following widget and put the interface in "playback" mode:

In this case the widget is initialized with a recent time span and some defaults.
The playback widget includes:
- Button to exit the playback mode
- Start and end dates
- A slider showing the current span of time that it's being reported
- A step duration parameter for stepping back and forth
- Typical playback buttons:
- to manually step back and forward
- to go to the start or end of the period
- to automatically execute the playback until the end of the period
-
When playing back a given deployment, a checkbox allows to indicate whether to only report the associated vehicle, or also the others indicated in the general report options:
Summary tab
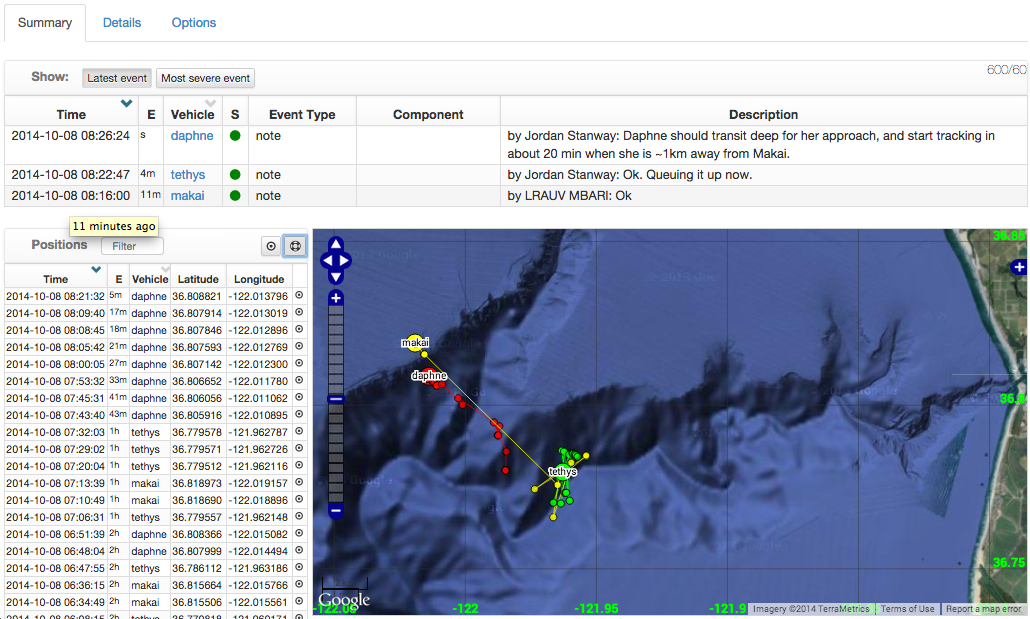
As shown in the figure, the summary tab contains an events table, a positions table, and a map:
-
The events table has a row per vehicle indicating the very latest or the most severe event associated with the vehicle;
-
The positions table contains all latest vehicle positions:
- The header of the table includes:
- a field to filter (i.e., select) elements in the table
- a button to center the map on the centroid of the very latest vehicle positions
- a button to zoom the map to an extent containing all the reported positions
- The columns are:
- Time in the timezone indicated in the current time badge (upper-left corner)
- Elapsed time
- Vehicle
- Latitude
- Longitude
- Button to center the map at the corresponding position.
- The header of the table includes:
-
The map displays the same latest positions in a graphical way:
- A different color is associated to each vehicle
- Latitude and longitude corresponding to mouse position is shown in the lower right part of the map
- Clicking a vehicle position will show the corresponding sea depth
- The very latest position of a vehicle is more prominently rendered
- The position hovered by the mouse on the position table is highlighted in the map.
Details tab
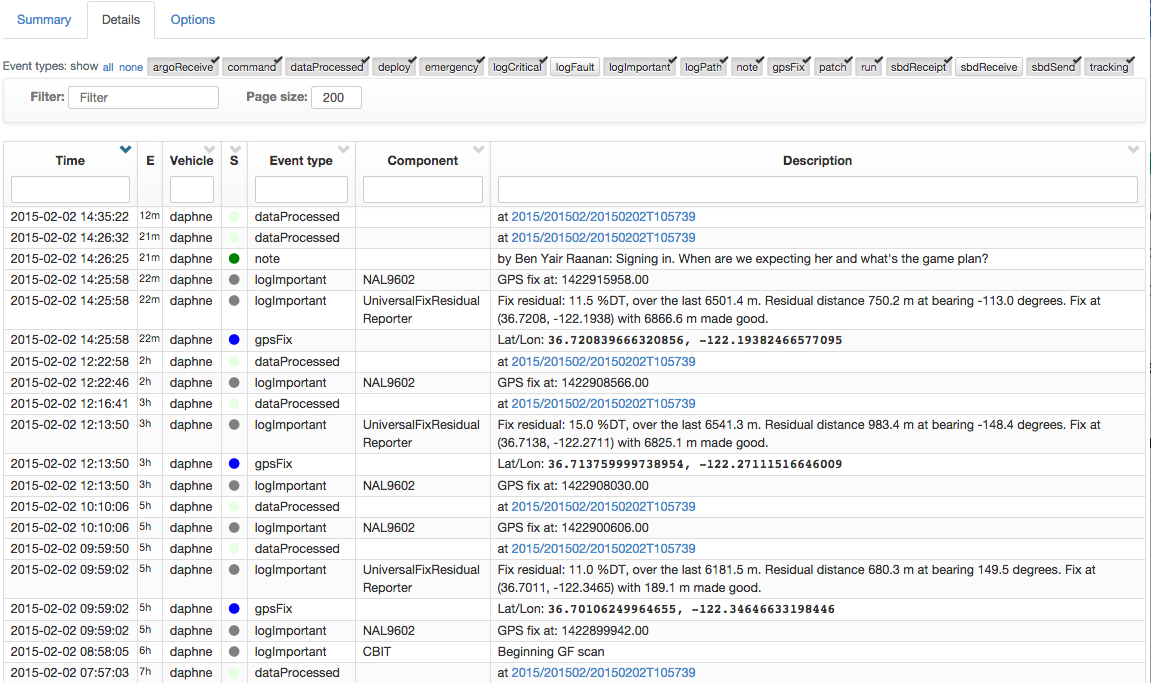
This tab shows a table with all events and positions according to the time window parameters specified in the Options tab (see below).
- The first section in this tab allows the user to select, from the loaded elements, the desired event types to display in the table.
- The next section has:
- a filter field that allows to select a subset of the table contents according to a given string. This selection is applied on the result of the event type selection;
- a field to indicate the desired page size for the table.
- Then comes the table containing the details of each event or position. The header of some columns includes a filter field that further allows to select elements on the corresponding column. These filters are applied after the global filter.
Options tab
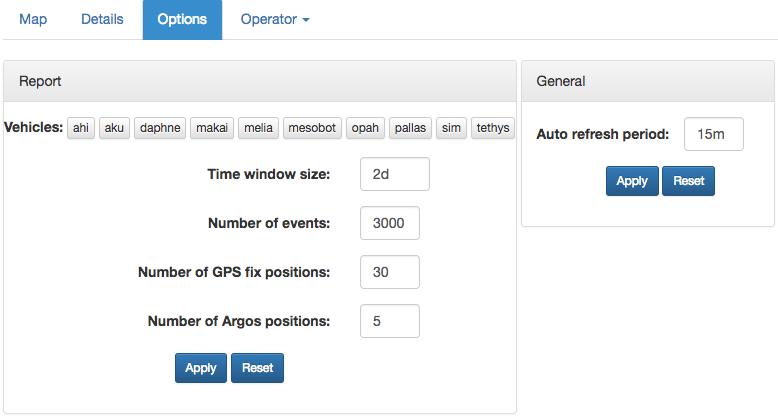
This tab allows to adjust various parameters:
-
Vehicles: Select the vehicles to be reported. Select none to report all vehicles according to other parameters.
-
Time window size: This parameter indicates the length of the time window to be reported by the application. This can be a number or a number with a suffix indicating the units, for example "hour" and "day." These can be abbreviated ("h", "d", etc.). By default, the units for the number is assumed to be "hour."
-
Number of events: Maximum number of most recent events within the time window.
-
Number of GPS fix positions: Maximum number of most recent positions within the time window.
-
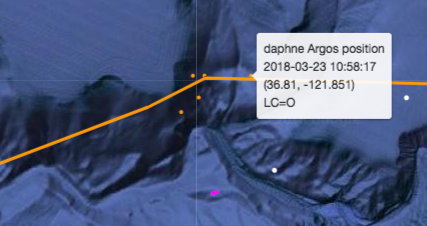
Number of Argos positions: Maximum number of most recent Argos positions to display per vehicle. These are displayed as dots on the map, with tooltip (when hovering over them with your mouse) indicating: name of the vehicle, time, latitude, longitude, and 'LC' indicator:
-
Auto Refresh period: This parameter allows to adjust the period of the timer used to update the information from the backend. Leave blank to disable auto refresh.
The parameters in this tab, as well as others in the general interface (e.g., timezone, selected event types, details table page size) are persisted across sessions by saving them as cookies in your browser.
Experimental options
See this section.
Operator tab
This tab will be included for logged in users with the "operator" role.
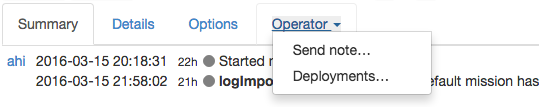
This tab is actually a drop-down list. Mouse over it to see the options:
Send note...
This option allows to capture and send a note:
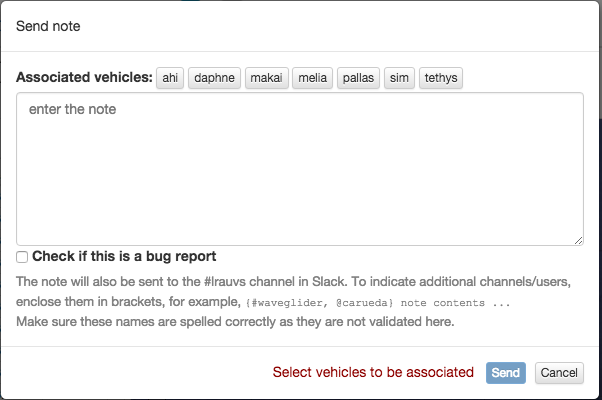
- Check the vehicles that are relevant for the note.
- Enter the text of the note.
Besides being captured in the database and immediately reflected for all other operators in their FleetStatus page,
the note will also be sent to the
#lrauvschannel in Slack. To indicate additional channels/users, enclose them in brackets, for example,{#waveglider, @carueda} note contents .... Make sure these additional channel/user indicators are spelled correctly as they are not validated here. - Select the "bug" checkbox if the note is about a misbehavior that should be addressed.
- Click Send to submit the note.
Deployments...
This option displays a table with all deployments associated with the selected vehicles according to the Options tab.
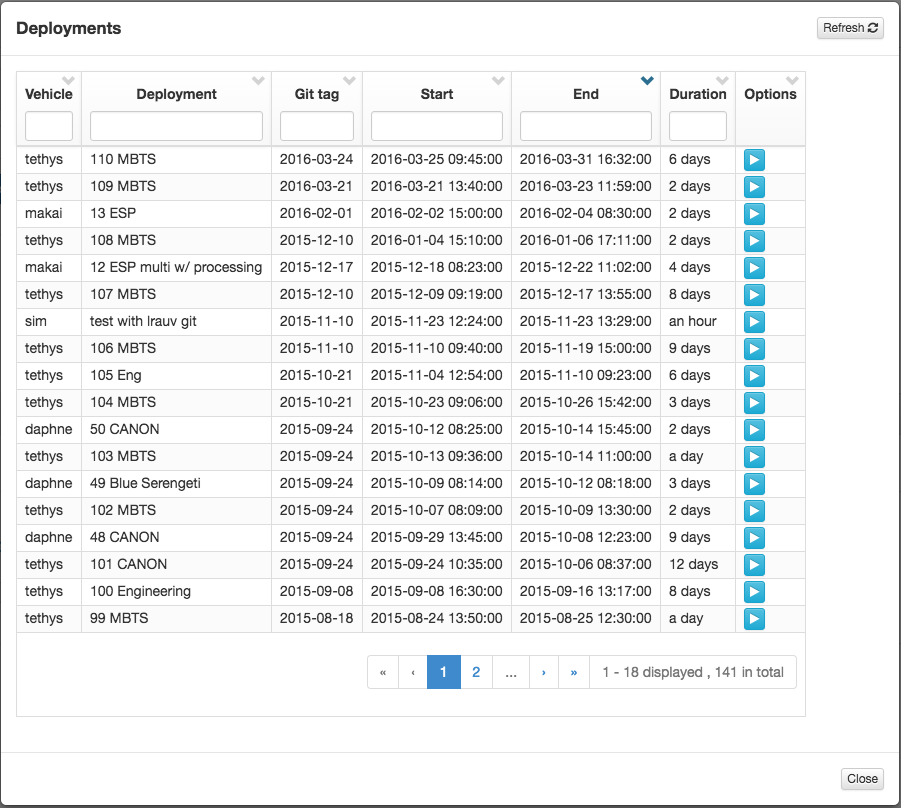
Click the Refresh button to reload the deployment information from the backend database.
For each deployment the columns of this table show:
- Vehicle name
- Deployment name
- Associated git tag
- Start and end dates
- Duration of the deployment
- Options:
- Playback the deployment
Other controls allow to filter the contents of the table by given strings in the corresponding column headers, and to navigate across pages in the table.