Samples and Data
Side menu → Samples and Data**
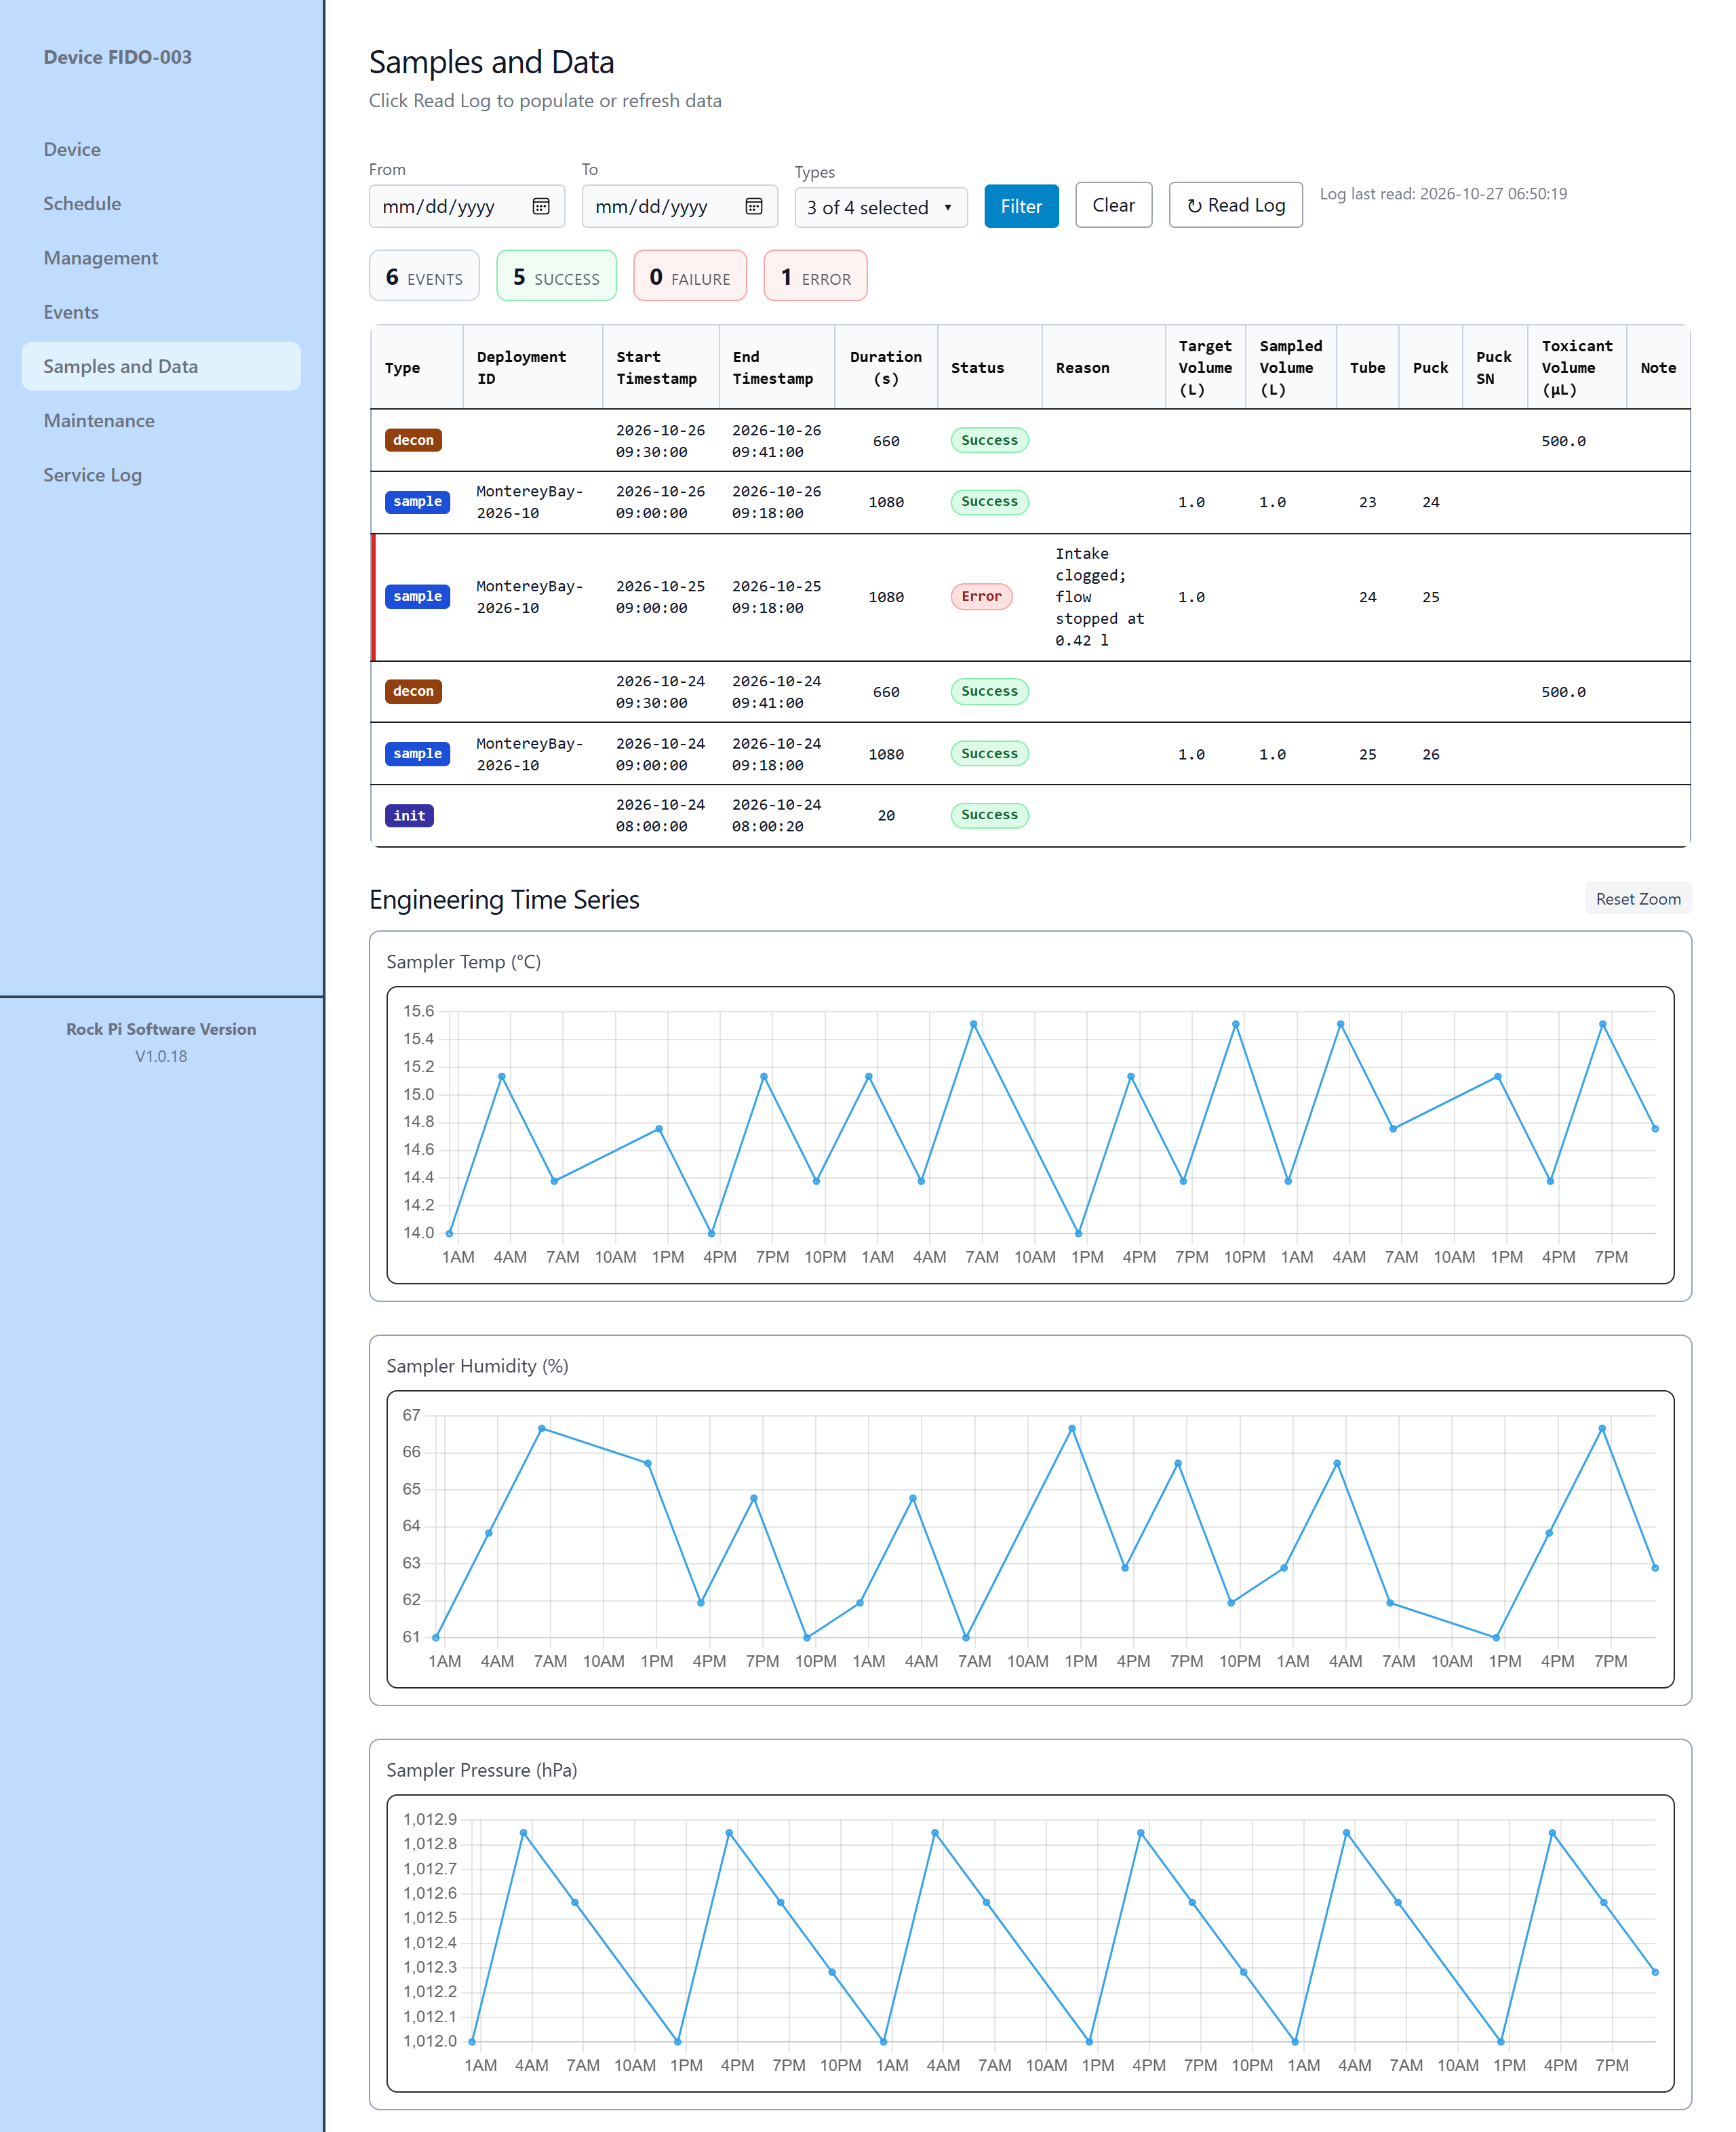
A table of every sample and decontamination the sampler has recorded, plus charts of conditions inside the sampler.
Loading the data
The page reads the sampler's full log only when you ask, because it can take a while. Click ↻ Read Log to load or refresh it. Until you do, the page says "The log hasn't been read yet".
Filtering
| Filter | Use |
|---|---|
| From / To | Limit to a date range |
| Types | Choose which kinds of events to show. Check all / Uncheck all help. |
Click Filter to apply or Clear to reset. The summary shows the number of Events, Success, Failure and Error for the current filter.
The table
| Column | Meaning |
|---|---|
| Type | What was done (for example a sample or a decontamination) |
| Deployment ID | The Deployment ID at the time |
| Start Timestamp / End Timestamp | When it started and finished |
| Duration (s) | How long it took |
| Status / Reason | Whether it succeeded and, if not, why |
| Target Volume (L) | Volume requested |
| Sampled Volume (L) | Volume actually filtered |
| Tube / Puck / Puck SN | Where the sample went, and the puck's serial number |
| Toxicant Volume (µL) | Volume of preservative added |
| Note | The note entered for a manual sample |
To confirm
What Toxicant Volume measures, and the list of Type values a user will see. The log parser fills it from the "Delivering Toxicant to intake" line, which in the app's own test logs comes during decontamination, so it may be the decontaminant dose, not a preservative.
Engineering Time Series
Charts of Sampler Temp (°C), Sampler Humidity (%) and Sampler Pressure (hPa) inside the enclosure. Drag to zoom, and use Reset Zoom to go back. A rising humidity can be an early sign of a leak.